I was born in a country (Brazil) where voting is mandatory. Most of my family still lives there, and now that I live in the US, they ask me about American politics all the time. One thing that often catches them by surprise is that not only is voting not mandatory here, but election participation is pretty low considering how much American political news pervades media coverage all over the world.
I thought it would be interesting to take a closer look at some voter registration data from the 2018 midterm elections. Below is some interesting information I came across as I started to explore that data with SAS Visual Analytics.
Voter registration and participation rates by state
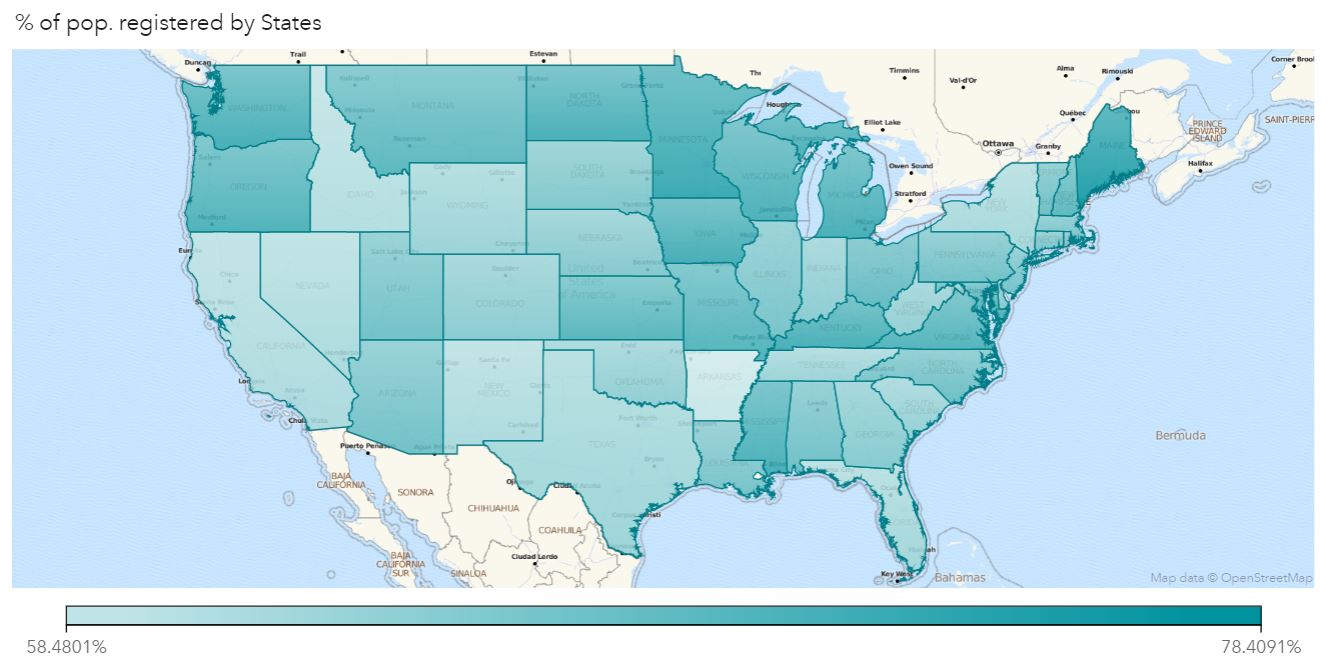
First, let's look at what percentage of the population is registered to vote in each US state.
Next, let's look at what percentage of the population votes in each of the continental US states.
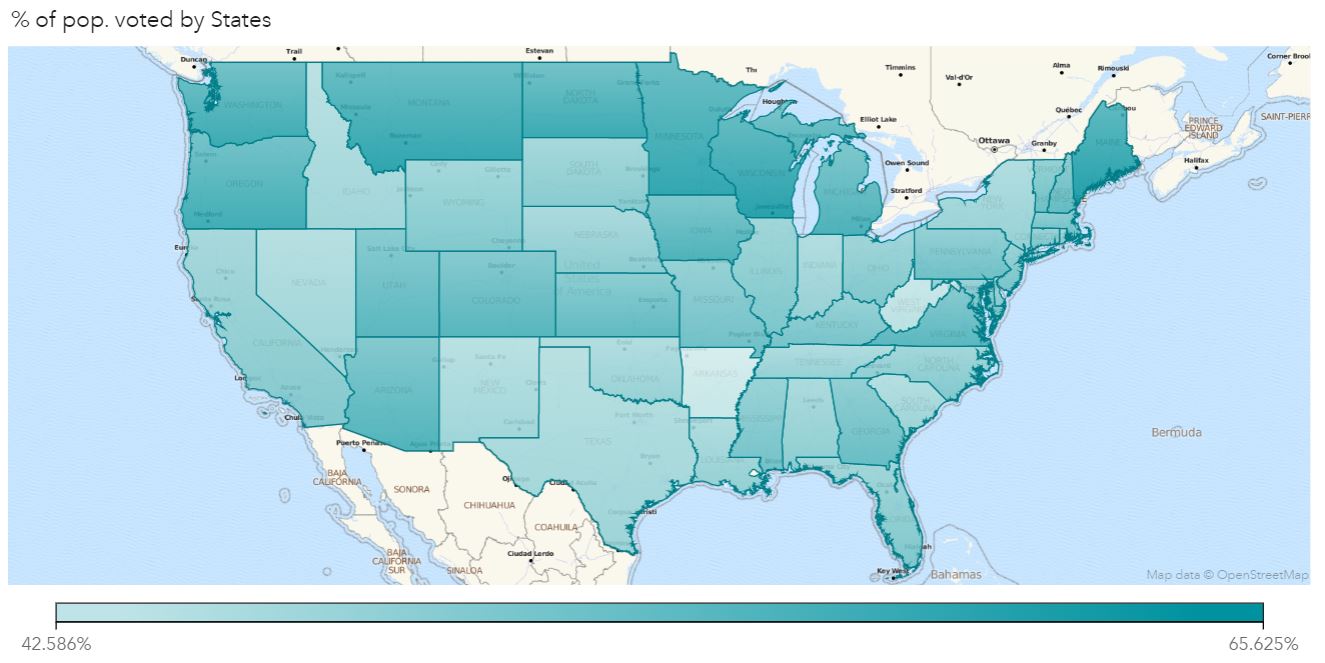
The mapping capabilities of Visual Analytics lets us quickly see that there is strong, clear relationship between voter registration rates and voter participation rates. In other words, states with the lowest voter registration rates are also the states with the lowest voter participation rates. This makes intuitive sense. However, we see some interesting differences between the states once we start to analyze voter registration and participation rates by different demographic groups.
Arkansas has both the lowest voter registration and participation rates in the continental United States when looking at the entire population of American citizens. However, it does not rank as poorly when looking at the voting rates of black, Hispanic, or youth (defined as being 18-24 years old) populations. South Dakota, South Carolina, and Hawaii have the poorest voter registration rates for those aforementioned groups.
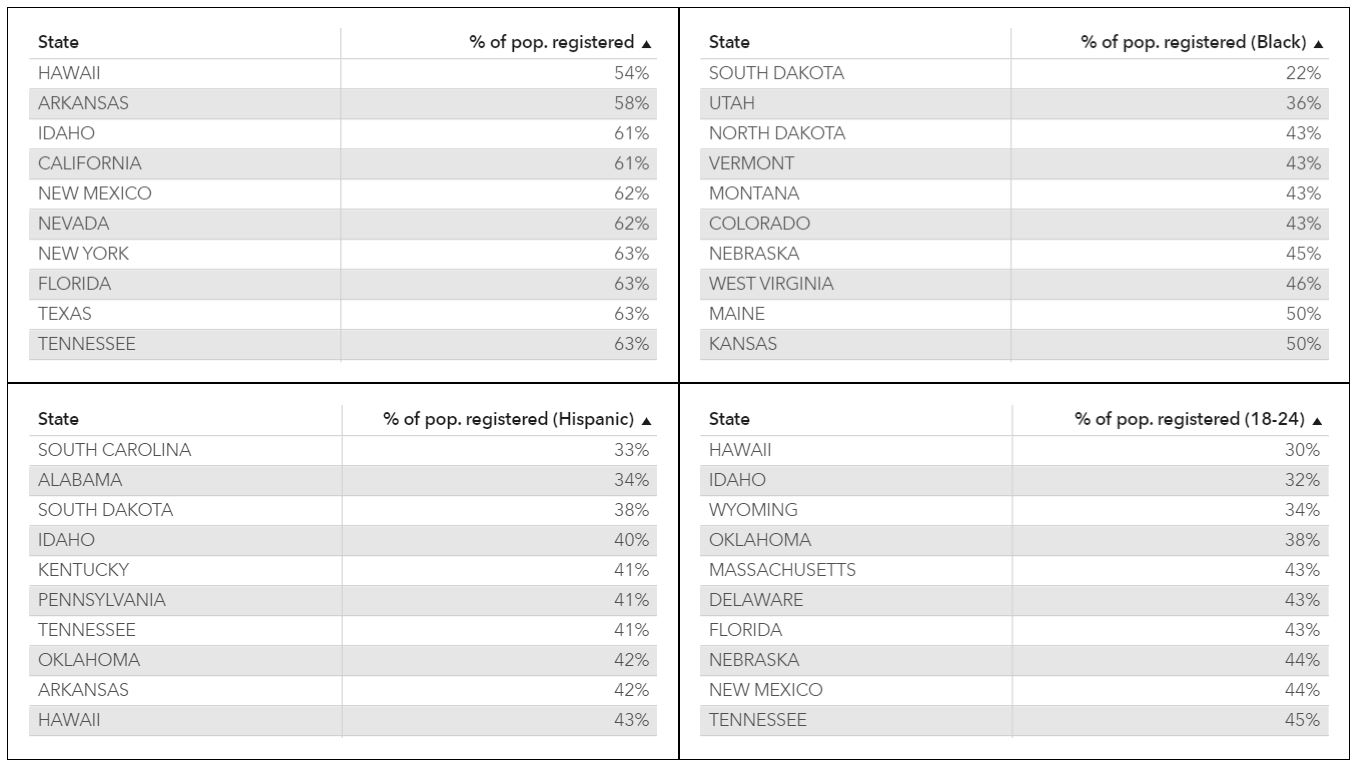
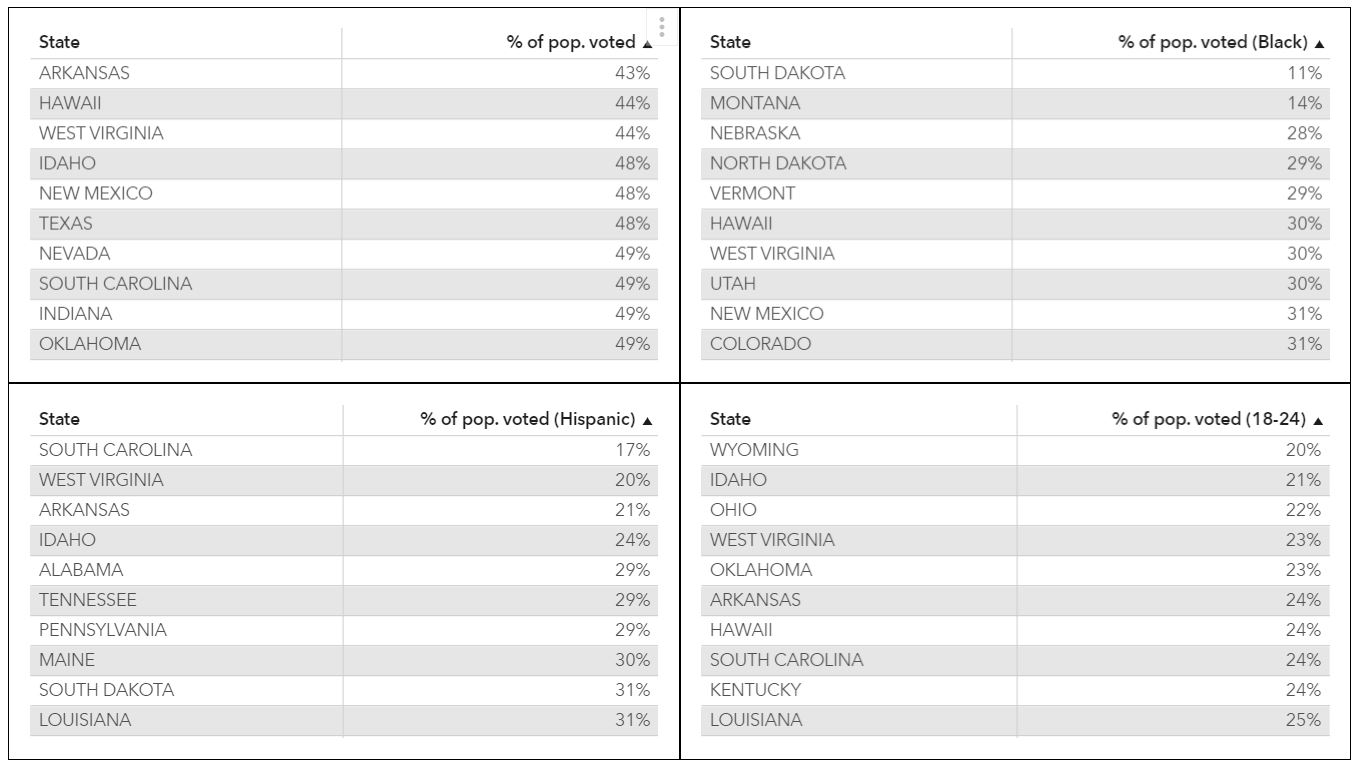
It is quite interesting to see that states with the lowest black voting rates are not the same states with the lowest Hispanic or youth voting rates. It’s also interesting that the states with the poorest rates are spread throughout the country and not geographically isolated to one or two regions.
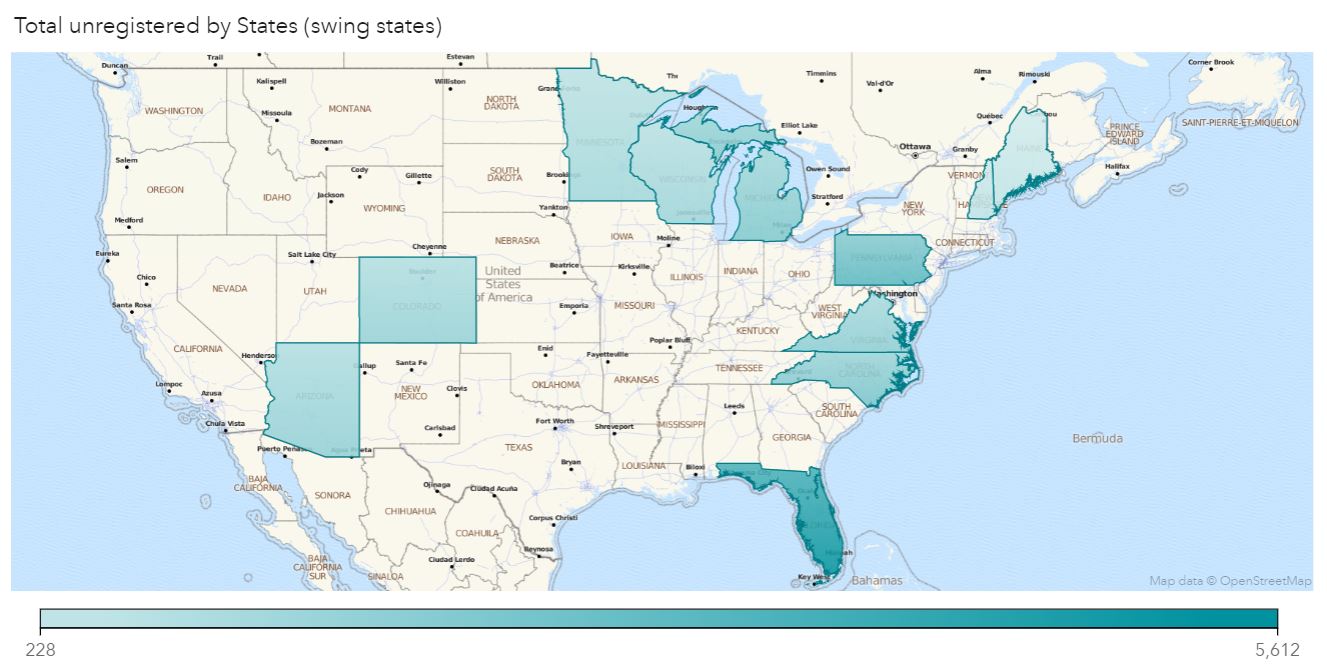
Next, let’s examine the swing states. Here we define a swing state as being a state where the most recent presidential election was decided by less than 5 percentage points. Those states are as follows: Arizona, Colorado, Florida, Maine, Michigan, Minnesota, Nevada, New Hampshire, North Carolina, Pennsylvania, Virginia, and Wisconsin.
A closer look at swing states
One might hypothesize that swing states would have the best voting rates since voters there might think that their votes are more likely to “matter.” However, the data tells us otherwise. On average, the swing states combined ranked 20th in voting registration and 16th in voting participation.
Florida is an especially interesting case study because many high-profile elections in the recent past have come down to very thin margins. In the most recent mid-term elections, the gubernatorial election was decided by 32,463 votes, and famously in the 2000 Presidential election, George W. Bush won the Sunshine State by 537 votes.
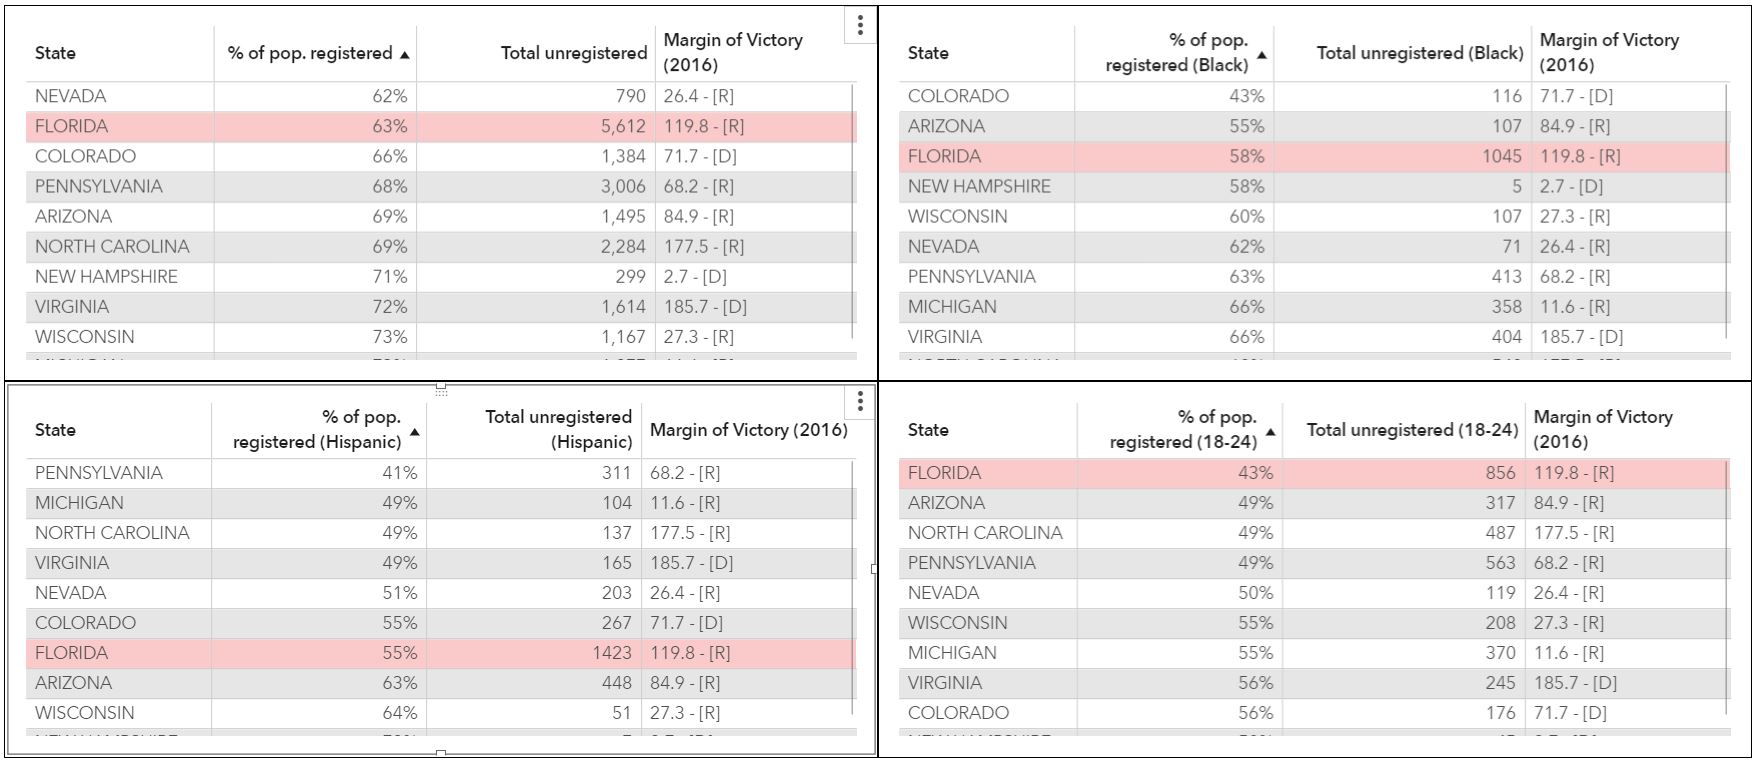
Florida is the best example to use to disprove that earlier hypothesis. Among the swing states, Florida has by far the most unregistered voters (see Figure 5). In addition, Florida has by far the largest ratio between total unregistered voters and margin of victory in the last Presidential election for all the demographic groups examined thus far (Figure 6).
Conclusion
The 2018 midterm election had the highest voter turnout for a midterm election since 1978. There appears to be some truth in the notion that the increased coverage and discussion of American politics across the world has led to increased voter turnout. However, there are still large swaths of untapped eligible voters across the country. Among swing states alone, the results of the next presidential election could all be flipped if even just one of the demographic groups shown above decided to register and vote for the losing party. Unrealistic? Very. But the truth remains – first-time voters (if they vote) could very easily swing the electoral outcome for their state in the upcoming 2020 race.
Curious to see your state’s voting registration and participation metrics? Sign up today for a free trial of SAS Visual Analytics and reach out to me at frank.silva@sas.com for a copy of the dataset I used for this blog.
Notes:
- Data was sourced from the United States Census Bureau. All figures are estimates.
- Data attributed to black citizens include black alone or in combination.
- Data attributed to Hispanic citizens include Hispanic of any race.