Small data and VRM

Jim Harris (@ocdqblog) explains the prediction he made about Small Data and VRM.
Jim Harris (@ocdqblog) explains the prediction he made about Small Data and VRM.
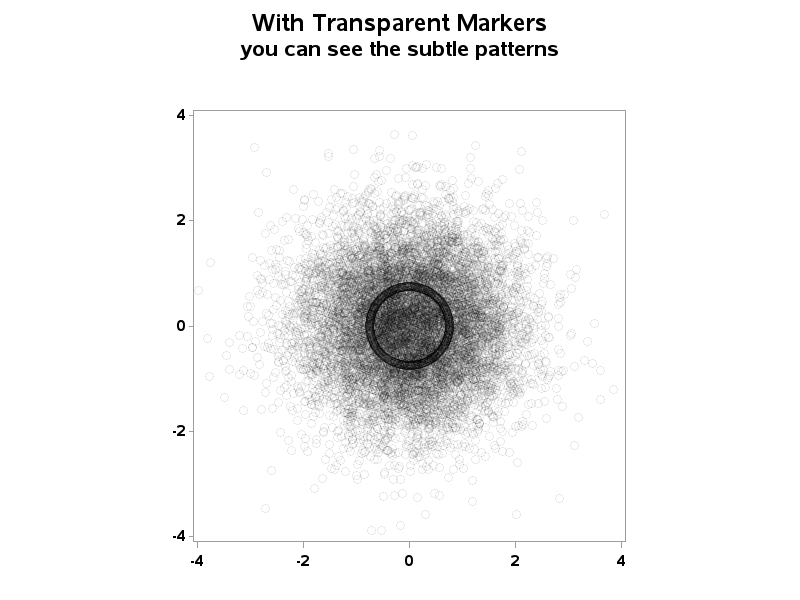
When working with "big data" you usually have too many points to view in a plot, and end up subsetting or summarizing the data. But now, in SAS 9.3, you have an alternative! For example, the following scatter plot of 10,000+ points is just a visual "blob": But using a new

The first time that I saw a demonstration of SAS Visual Analytics Explorer was awesome, but it didn't give me goosebumps. I got goosebumps the size of golfballs during SAS Global Forum Opening Session when Dr. Goodnight sat down at a computer screen and began to demonstrate how effortlessly users can

