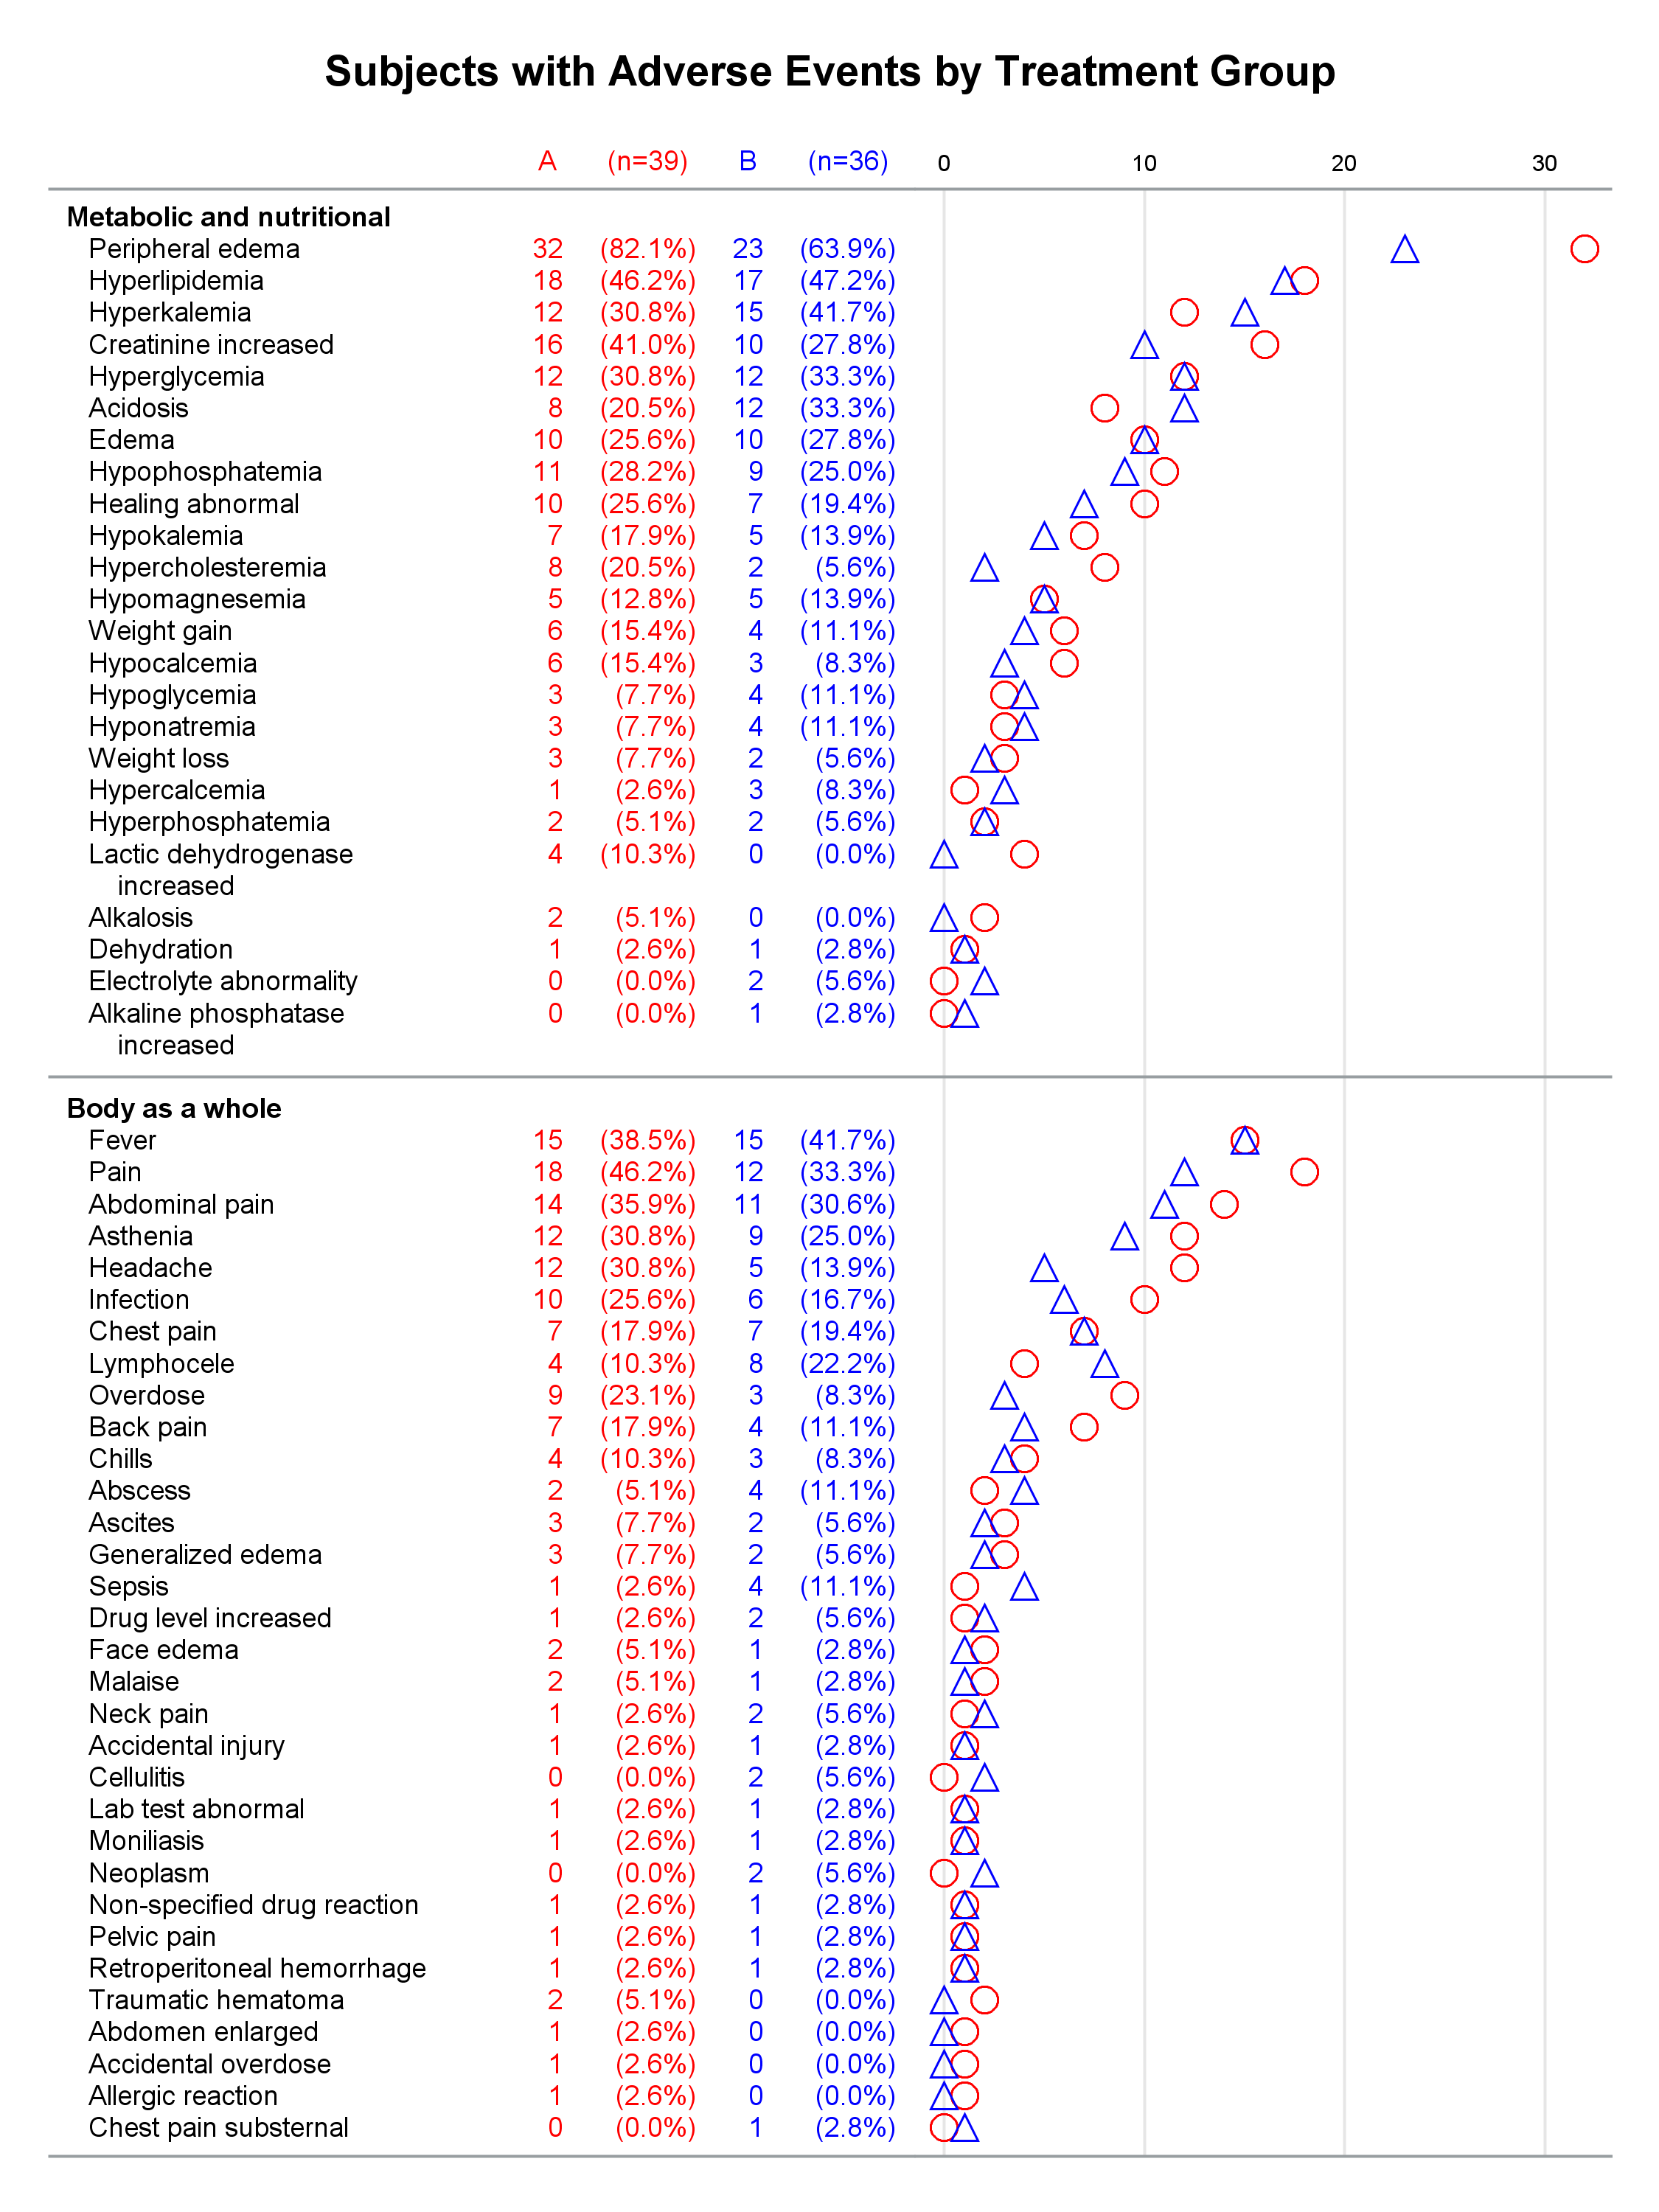
Did you know that you can make a graph extend across multiple pages? Making a multipage graph poses no problem for ODS Graphics---you simply use a BY variable to create page breaks. Most of the work involves deciding where to break pages and properly labeling continuations.
Tag: adverse events
As promised, here is a better combined AE-CM graph, using some of the UI improvements suggested by our UI expert, Riley. His suggestions helped to reduce the clutter in the graph, while still keeping all the features preferred by our users. Click on the graphs for a higher resolution image.
In my previous article on Adverse Event Timeline Graph, I wrote about how to create the AE timeline using SAS 9.2 code, using VECTOR plot and the MARKERCHAR option in SCATTER plot. I described a better way to place the labels at the lower end of the vectors. SAS 9.3 provides an easier way
The Adverse Event Timeline graph posted earlier used the MARKERCHAR option of the SCATTER plot to draw the AE names. This option places a center-justified label at the marker position. There is no option in SAS 9.2 version to right-justify the label. Hence, we have to compute an offset in data