ODS Graphics is easy. All you need to do is ensure that ODS Graphics is enabled and analytical procedures automatically produce graphs. ODS Graphics is extensible. You can easily create your own graphs by using procedures such as SGPLOT, SGPANEL, and SGSCATTER. ODS Graphics is customizable. You can use techniques such as advanced options, SG Annotation, template modification, attribute maps, the ODS document, and many other techniques to create customized graphs. The combination of the simple and more advanced options enable you to make a wide variety of graphs. For more information, see Basic ODS Graphics Examples and Advanced ODS Graphics Examples.
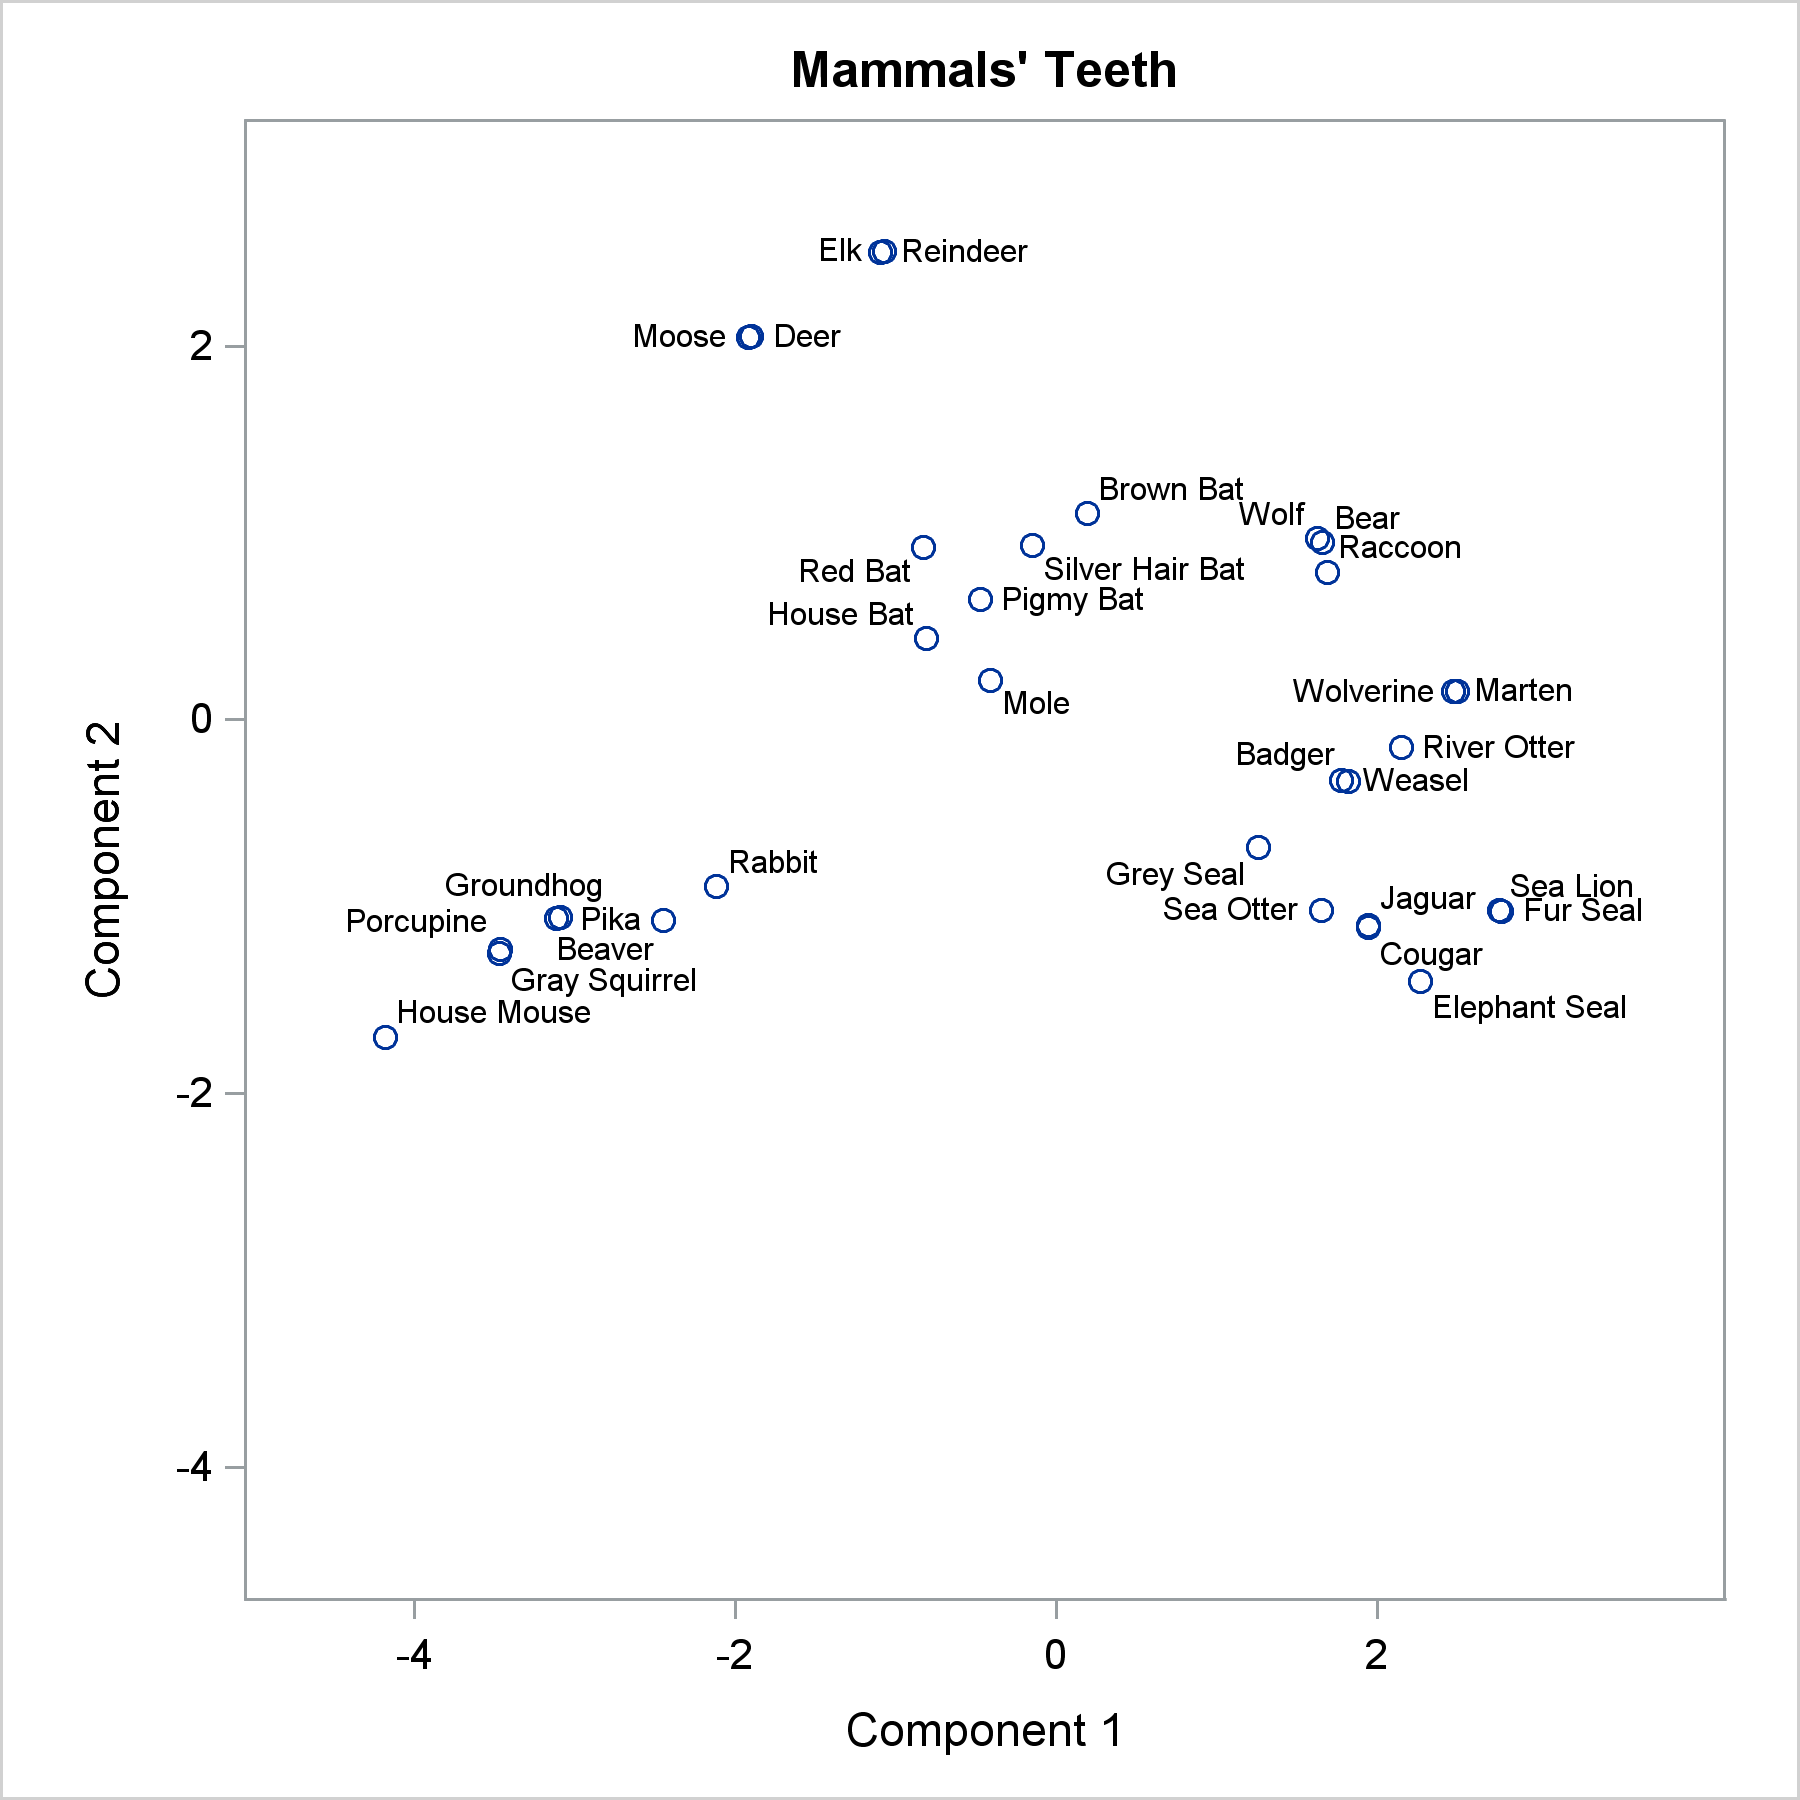
Advanced ODS Graphics: Applying the POSITION= option to scatter plots

The POSITION= option in the TEXT statement provides you with a way to position text in a variety of locations relative to a point. You can use this option to fine tune label placement in a plot primarily created by using the SCATTER statement and the DATALABEL= option.