ODS Graphics is easy. All you need to do is ensure that ODS Graphics is enabled and analytical procedures automatically produce graphs. ODS Graphics is extensible. You can easily create your own graphs by using procedures such as SGPLOT, SGPANEL, and SGSCATTER. ODS Graphics is customizable. You can use techniques such as advanced options, SG Annotation, template modification, attribute maps, the ODS document, and many other techniques to create customized graphs. The combination of the simple and more advanced options enable you to make a wide variety of graphs. For more information, see Basic ODS Graphics Examples and Advanced ODS Graphics Examples.
Advanced ODS Graphics: PROC SGPLOT, BY groups, and SG annotation

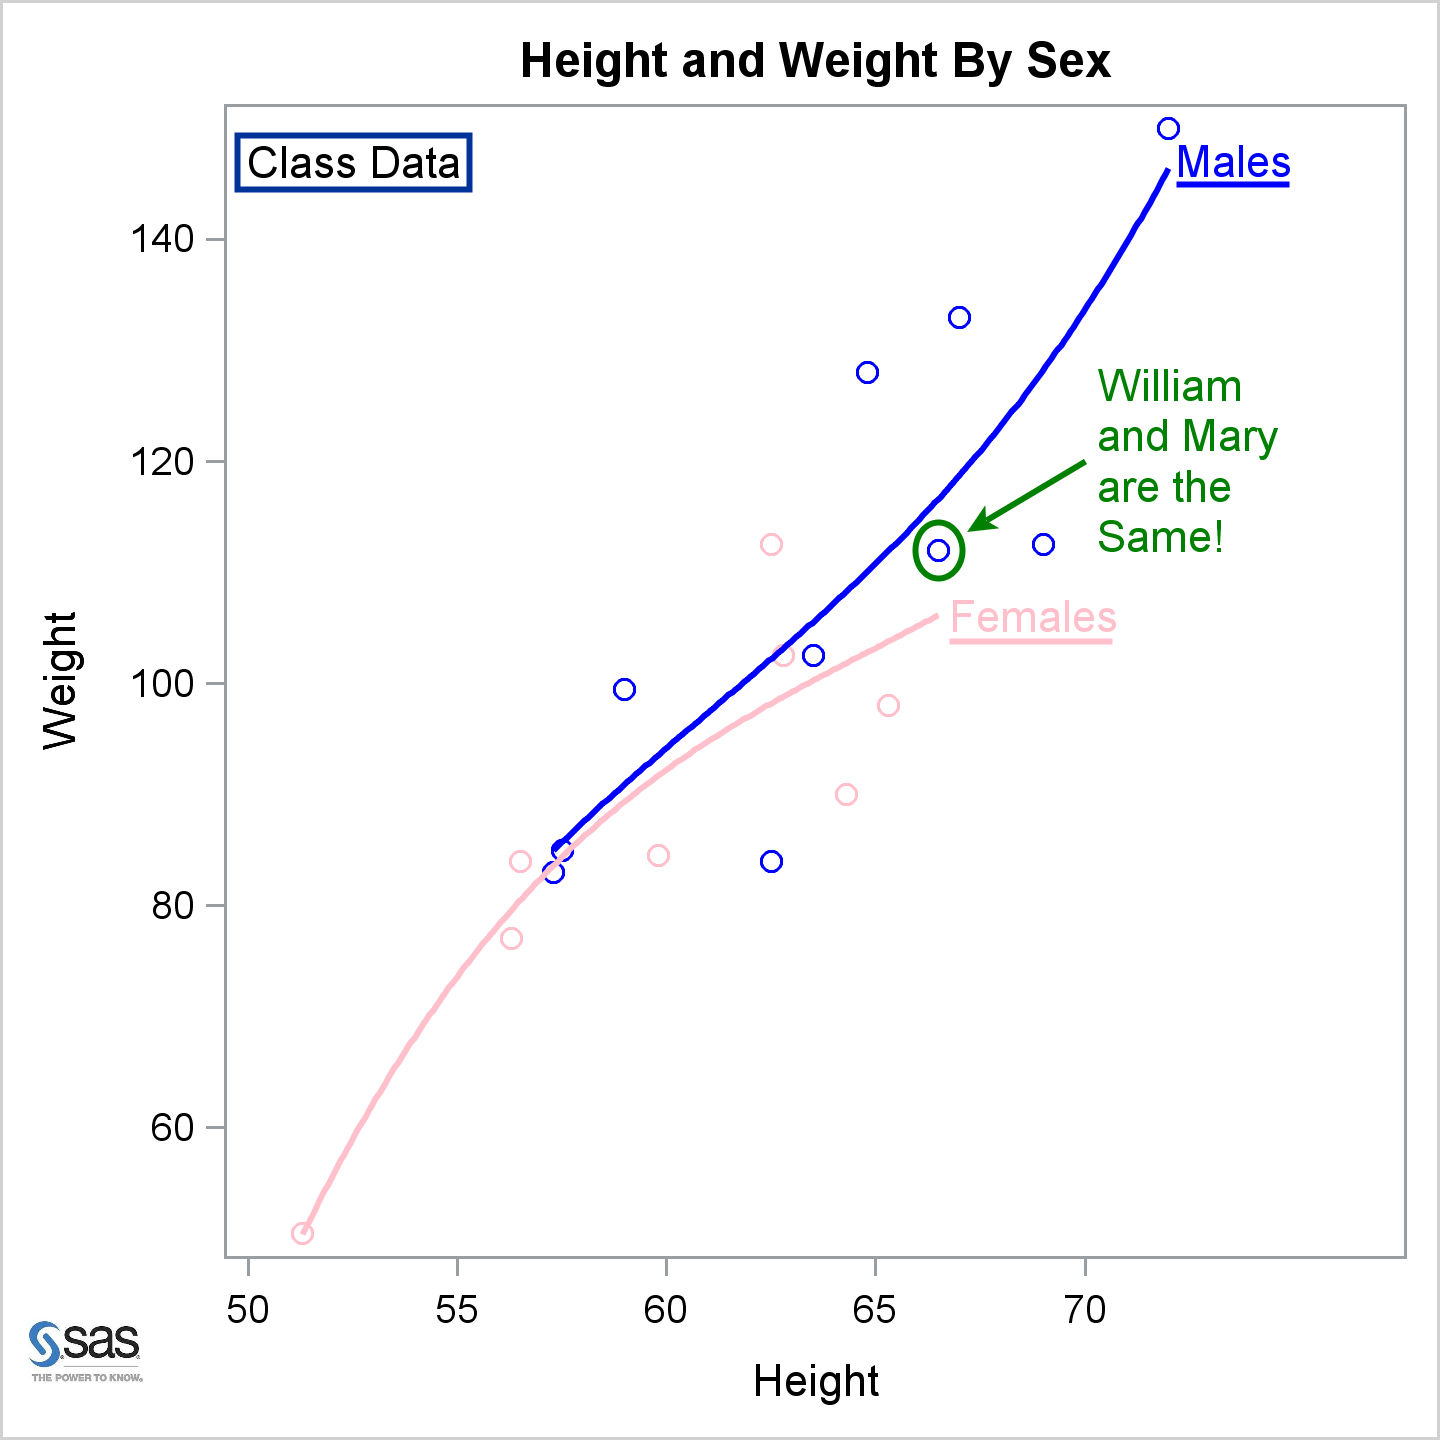
You can use PROC SGPLOT, BY variables, and a SG annotation data set together to put separate annotations into each BY group. However, you need two more steps to make it happen. This post shows all of the steps necessary to put different annotations into each graph when you have a BY variable.