How to clear the output window in SAS 9.3

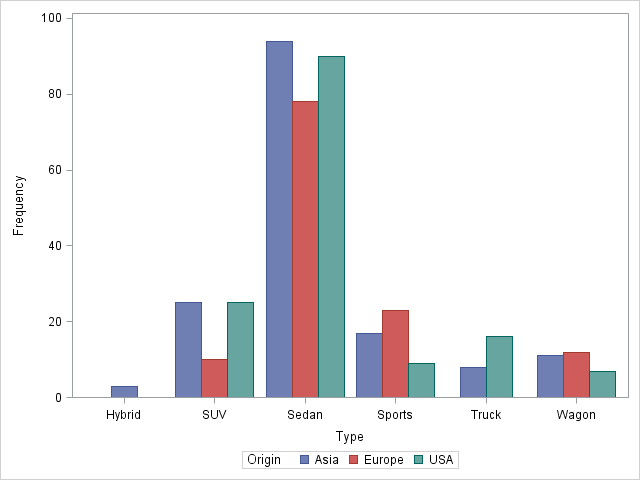
One of the highly visible changes in SAS 9.3 is the fact that the old LISTING destination is no longer the default destination for ODS output. Instead, the HTML destination is the default. One positive consequence of this is that ODS graphics and tables are interlaced in the output. Another