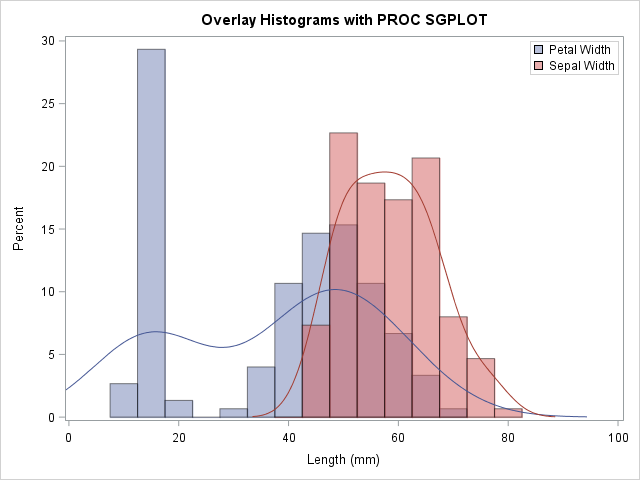
You can use histograms to visualize the distribution of data. A comparative histogram enables you to compare two or more distributions, which usually represent subpopulations in the data. Common subpopulations include males versus females or a control group versus an experimental group. There are two common ways to construct a
Tag: 13.2
A feature of SAS/IML 13.2 (shipped with SAS 9.4m2, Aug 2014) is the ability to execute SAS/IML statements that are in a file. The feature is implemented by the new EXECUTEFILE subroutine. This feature is similar to the CALL EXECUTE statement. The difference is that the EXECUTEFILE subroutine reads, parses,
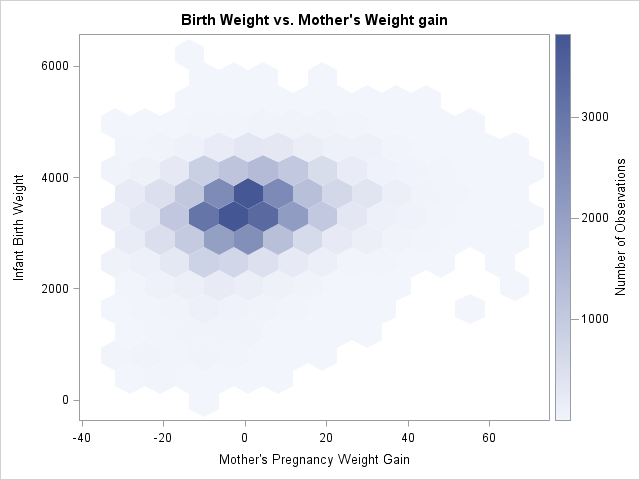
While I was working on my recent blog post about two-dimensional binning, a colleague asked whether I would be discussing "the new hexagonal binning method that was added to the SURVEYREG procedure in SAS/STAT 13.2." I was intrigued: I was not aware that hexagonal binning had been added to a
How old is your version of SAS software? The graph on the left shows the release dates for various releases of SAS software, beginning with SAS 8.0. The graph is based on a graph on Jiangtang Hu's blog that shows the major SAS releases. As this graph demonstrates, SAS software