This article is a follow-up to Creating a Multi-stage Computer Vision model to detect objects on high-resolution imagery by Neela Vengateshwaran and Robert Blanchard.
Overview
If you’ve read Robert and Neela's first article in this series, you already know that the star of our show is Dr. Taco. He is a mischievous little dog who is always up to something fun like stealing a treat… even chocolate! We all know that chocolate is not good for dogs, so we need to stop him and keep him safe. Dr. Taco also loves accessorizing with different colored collars and scarves and we can use his fashion sense to our advantage. In this article, I will show you how to deploy multi-stage deep learning (DL) models in SAS Event Stream Processing (ESP) and leverage ESP on Edge via Docker containers to identify events of interest. Then, we will talk about potential improvements and future possibilities.
Intro/review of the DL models
In the first part of this series, we saw how Neela and Robert used SAS Visual Data Mining and Machine Learning Software (VDMML) capabilities to develop two deep learning models: a YOLOv2 model to first find Dr. Taco inside an image and a ResNet-50 model to identify Dr. Taco regardless of if he's wearing a different color scarf. We now have a video source that comes from a high-resolution drone camera that records Dr. Taco's activities and watches out for his scarf color. Our goal is to deploy these 2-stage DL models to process a high-resolution drone video capture. In stage one (the YOLOv2 model), we will find Dr. Taco, frame him, extract the frame and shrink it. Then, we will apply the second stage (the ResNet-50 model) to catch the little thief in the act of stealing a chocolate treat and label the action according to Dr. Taco's collar color. If his collar is red, white or blue then he stole the treat, otherwise he hasn't stolen yet). To process and visualize the video stream, we will use SAS ESP deployed in a Docker container (with and without GPU support).
How are we going to deploy the SAS DL models?
We will use a SAS ESP Engine to create an event stream processing project, deploy our 2-stage models and score the video stream while annotating. To build this project we can use XML code or we can use the SAS ESP Studio user-friendly UI and build the project with point-and-click functions. This ESP engine can easily process many modeling objects including DL model ASTOREs.
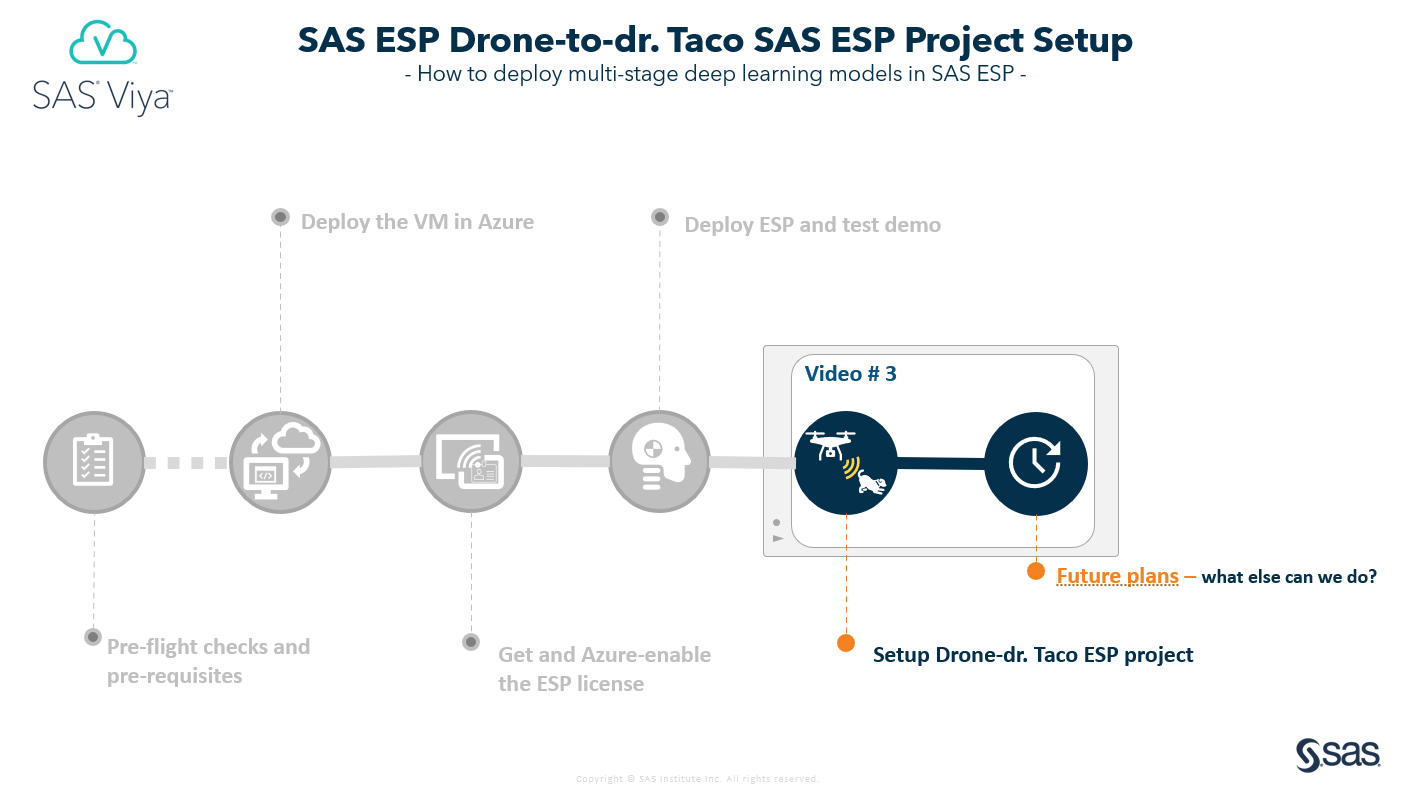
How are we going to deploy the SAS ESP Engine?
As with all projects, the setup is the most important part. For Dr. Taco, the setup would just be us forgetting some chocolate on the table; stealing it would be so easy for him! In our case, setting up the containers with ESP is the most important step. We must ask ourselves some key questions. Do we need a GPU to process this? Do we have a high enough resolution and framerate? These factors will also determine if it will be better to run the container locally or in the cloud (Azure in this case). Our video source is 60 FPS with a resolution over 3000x2000 and we will deploy both locally and in the cloud, just to get a sense of the difference. We have a couple of deployment options to decide between…
Option 1
SAS ESP Engine in an Azure NVIDIA GPU Virtual Machine deployed in a Docker container. The stream viewer is the video source that pushes the video stream through the ESP engine and allows us to view both the original video and the annotated video stream side-by-side.
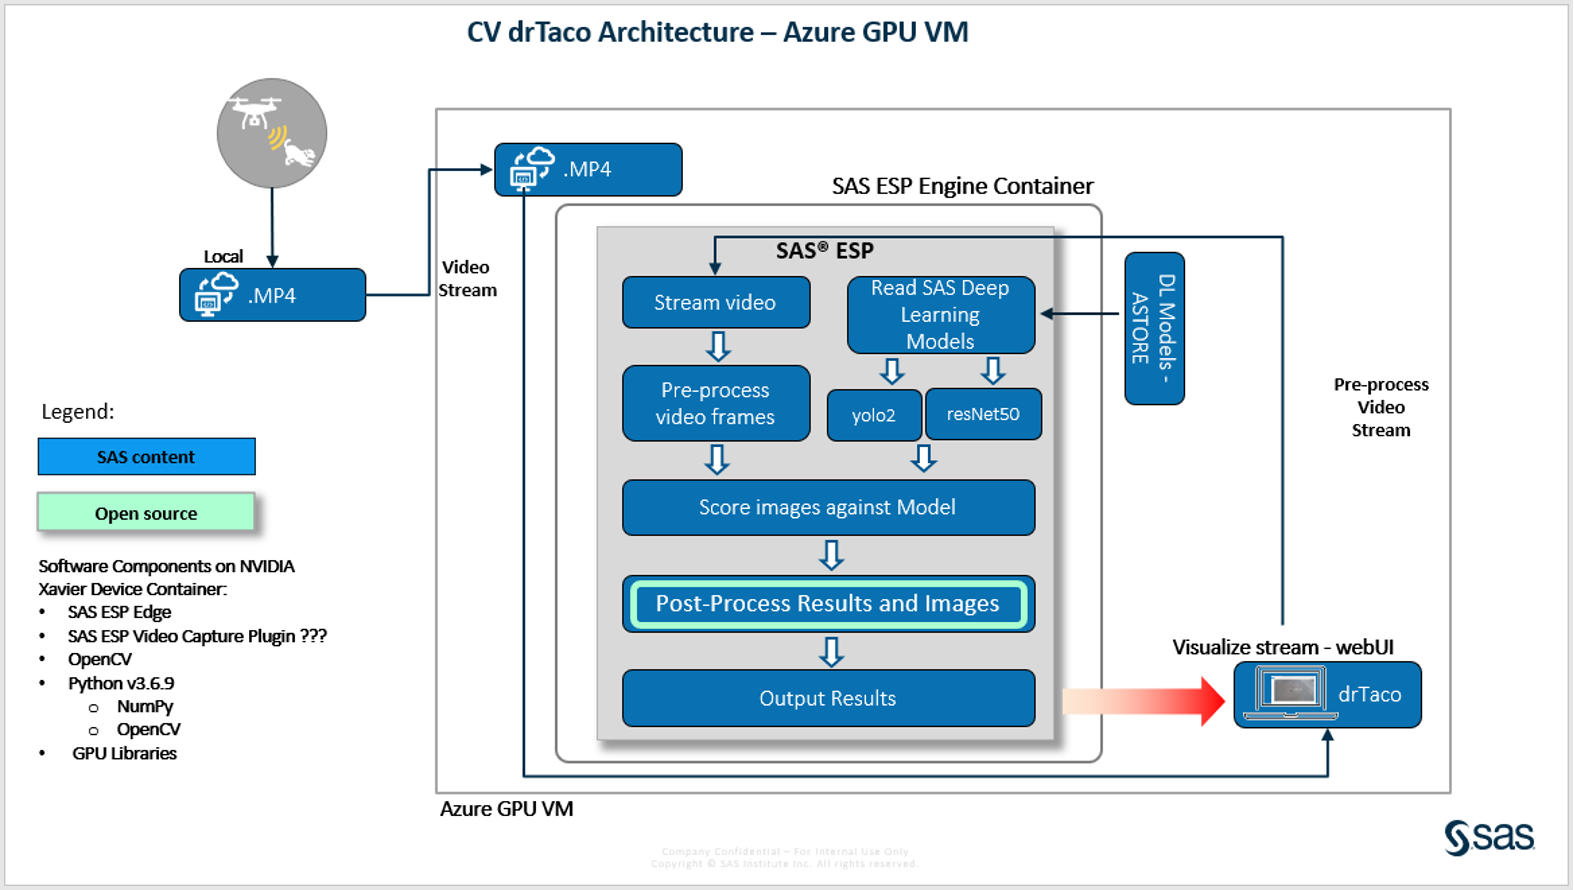
We have a container for SAS ESP Studio UI which allows us to connect to different ESP servers, build our ESP project, deploy the DL models and use other stream processing features on events identified in the stream. We will deploy the SAS ESP Engine in a container inside an Azure NVIDIA GPU Virtual Machine and we will leverage the GPUs for faster processing. With this setup, the webUI that we use for the stream viewer will also be the source of our video stream, as the browser will be pushing the video through the ESP project via a little Python code.
For testing the ESP project, we will capture some "event" frames and use those as the source to ensure that our models are deployed correctly and that the events of interest are identified and processed correctly.
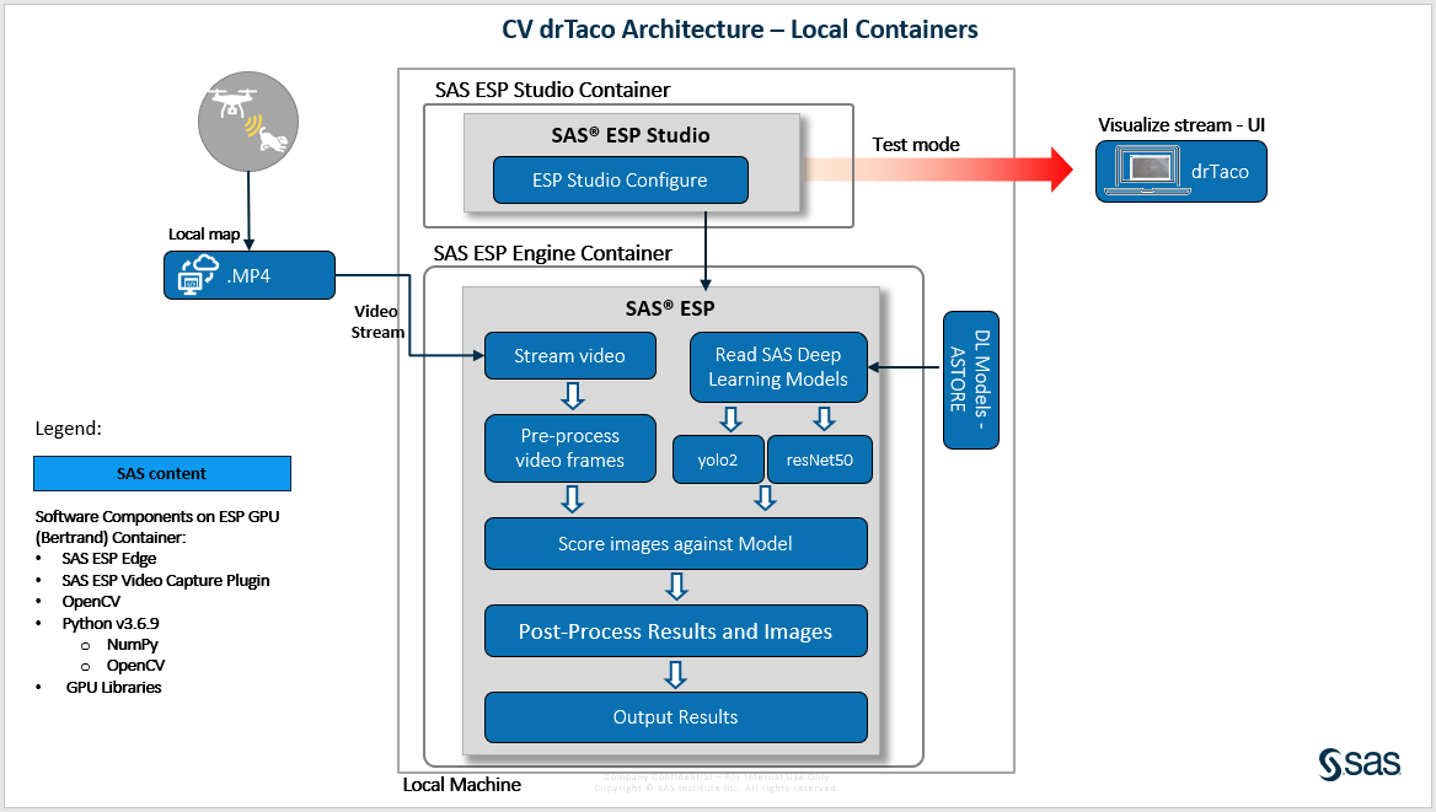
Option 2
SAS ESP Engine in a local Docker container using a custom videoCapture plugin to stream the process video directly from the raw MP4 video source, allowing us to view the annotated stream through an HTML viewer.
With this deployment option, the ESP project setup is almost identical to what we see in Option 1. The difference is that we are also defining an Input Publisher Connector to use the raw video as the video source instead of having an intermediary, the stream viewer, as the video source for the ESP project. We are not leveraging GPUs and therefore, we would have to accept that stream processing for this high-resolution video would be a bit slower. Using the input publisher will also allow us to view the stream in test mode.
With both options considered, we will proceed with Option 1.
Configure the ESP project step by step
Step 1: ESP server connection and project variables
Connect to the ESP server on the VM, go to 'ESP Servers' and add new:
- name =
- host = FQDN from you Azure resource
- port =
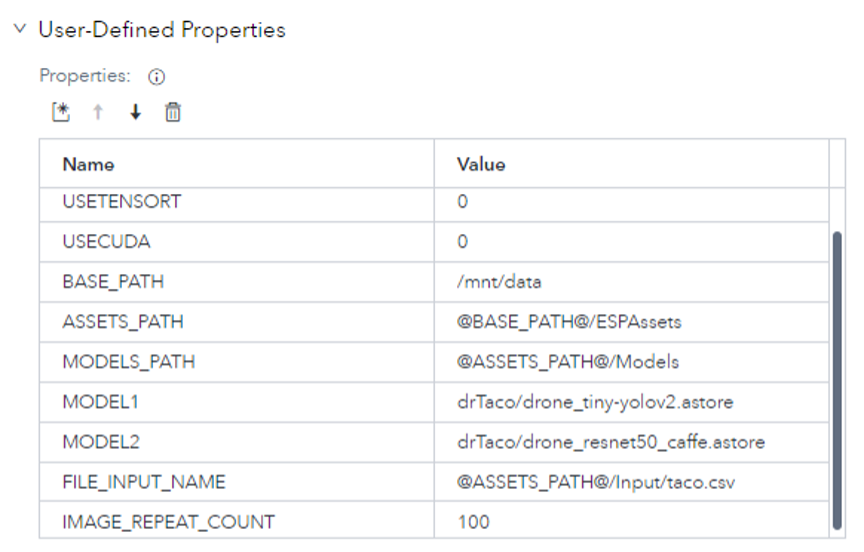
Create project variables because they will help us configure nodes more easily and change project parameters without having to remember full file system paths on the VM. Ensure that no node is selected in your project (if you have an empty screen, you're good to go), click on the 'project' icon button on the top right corner, go to 'User-Defined Properties' and create the following variables. Make sure to assign your model names to the model variables and the file_input_name.
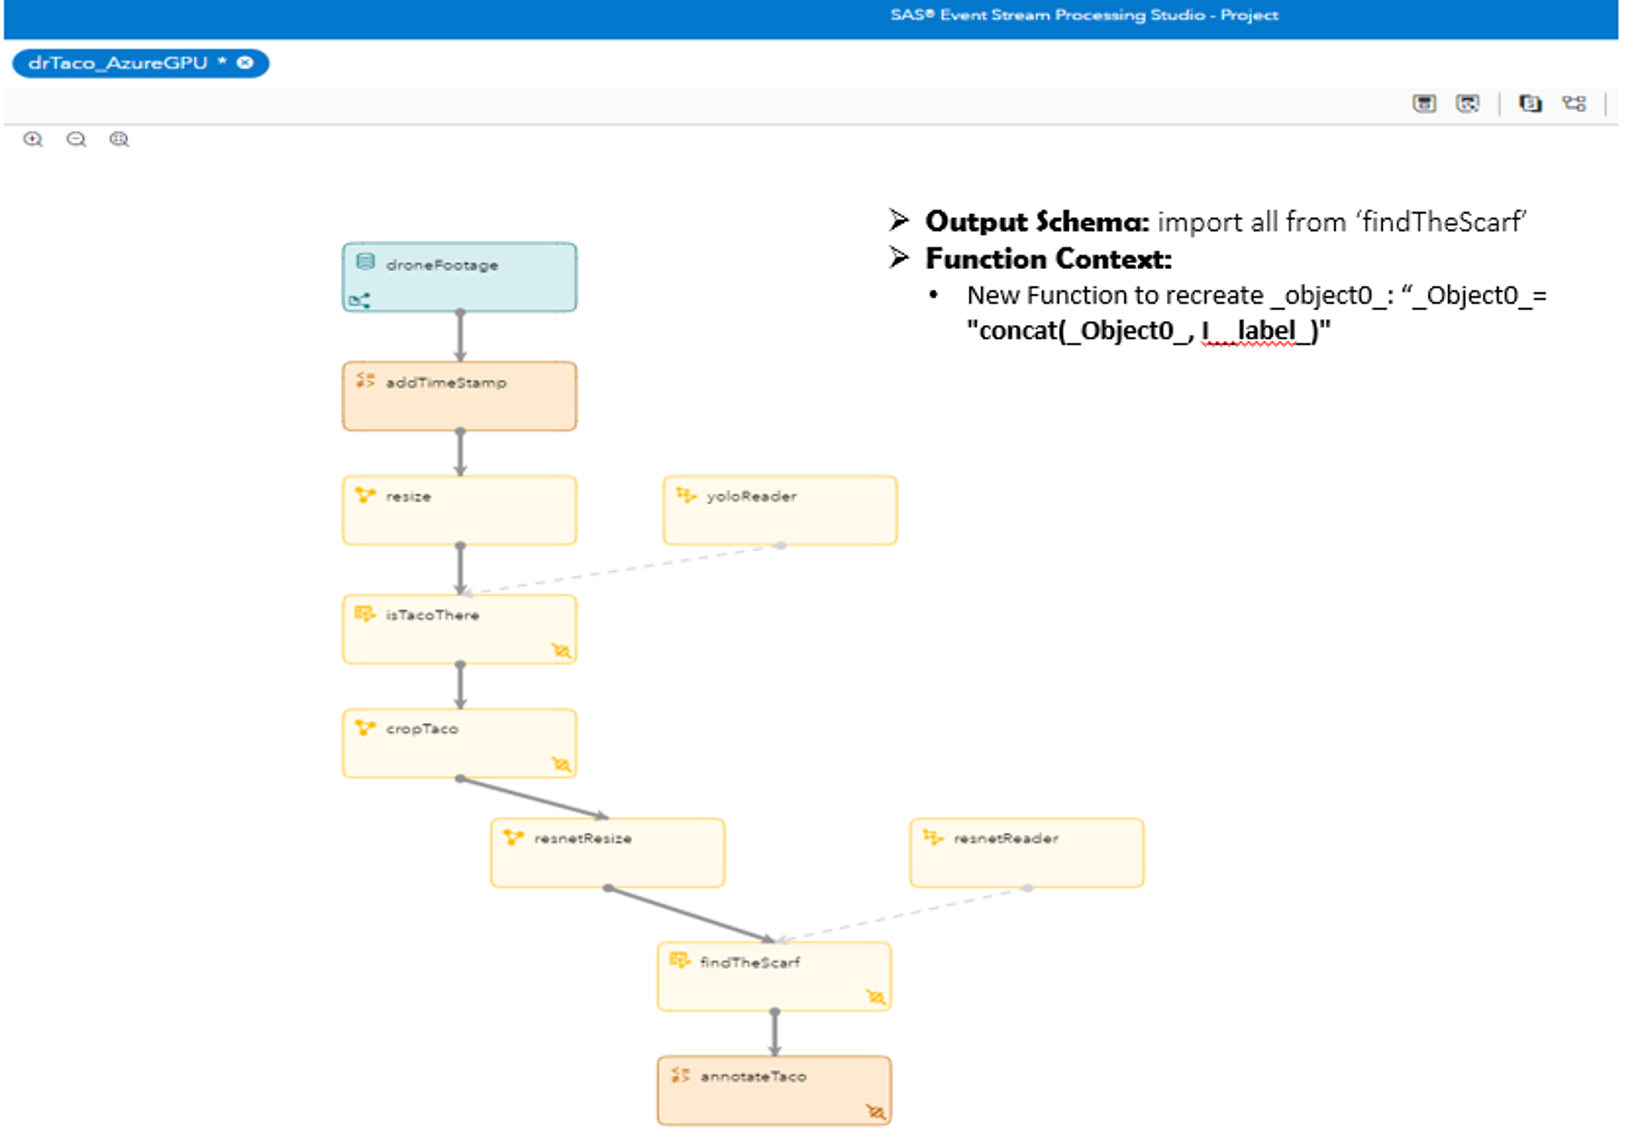
Step 2: Building the ESP Studio Project
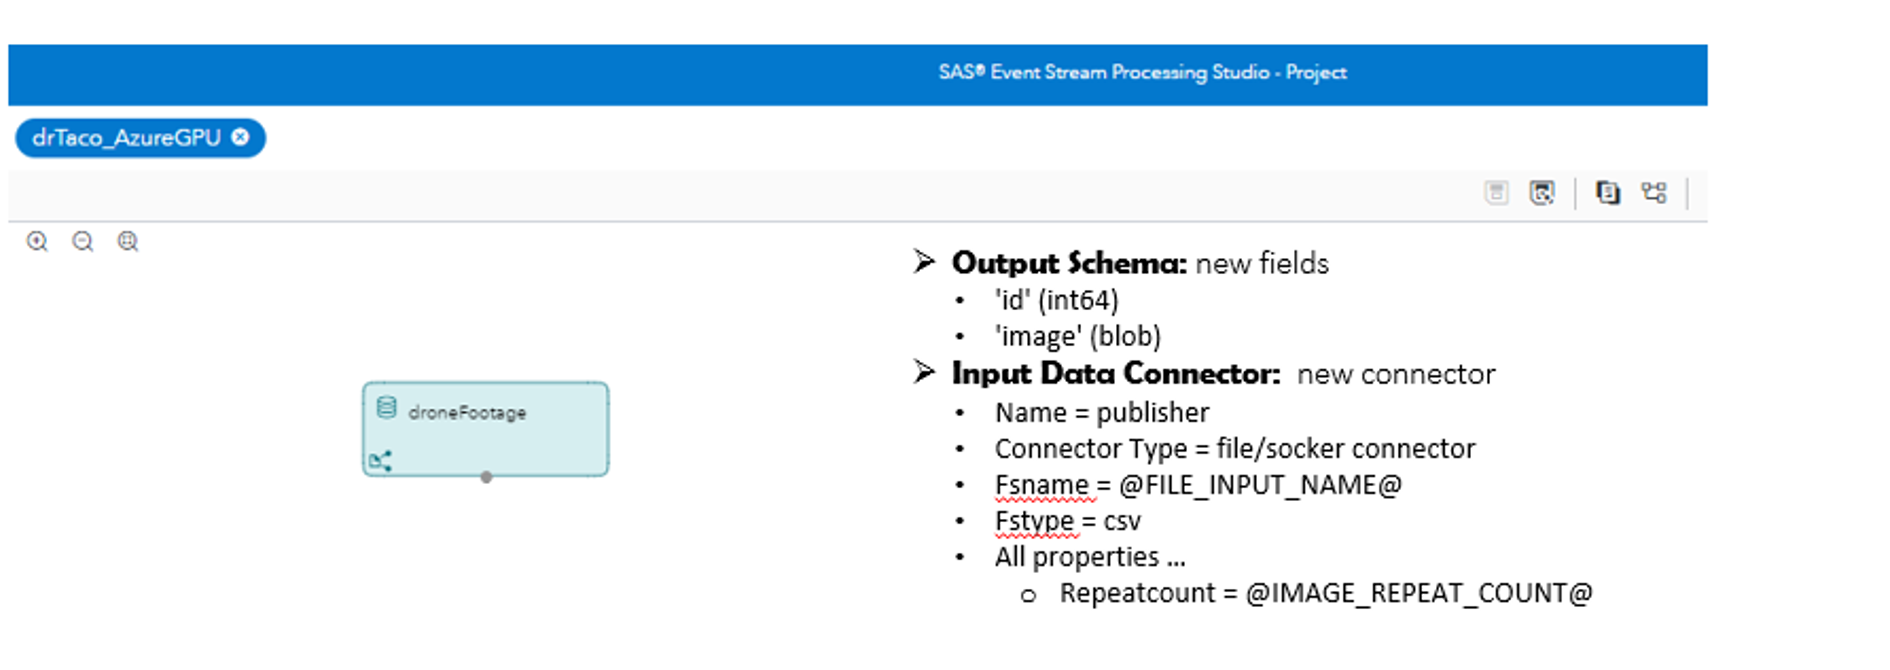
Step 2.1 - Source Window -1- 'droneFootage'
We need this window for testing purposes only. To configure, add a source window node and assign the following properties:
Step 2.2 - Functional Window -2- ‘addTimeStamp’ (optional)
This is to capture the timestamp for the event identified. To configure, add a functional window node and assign the following properties:

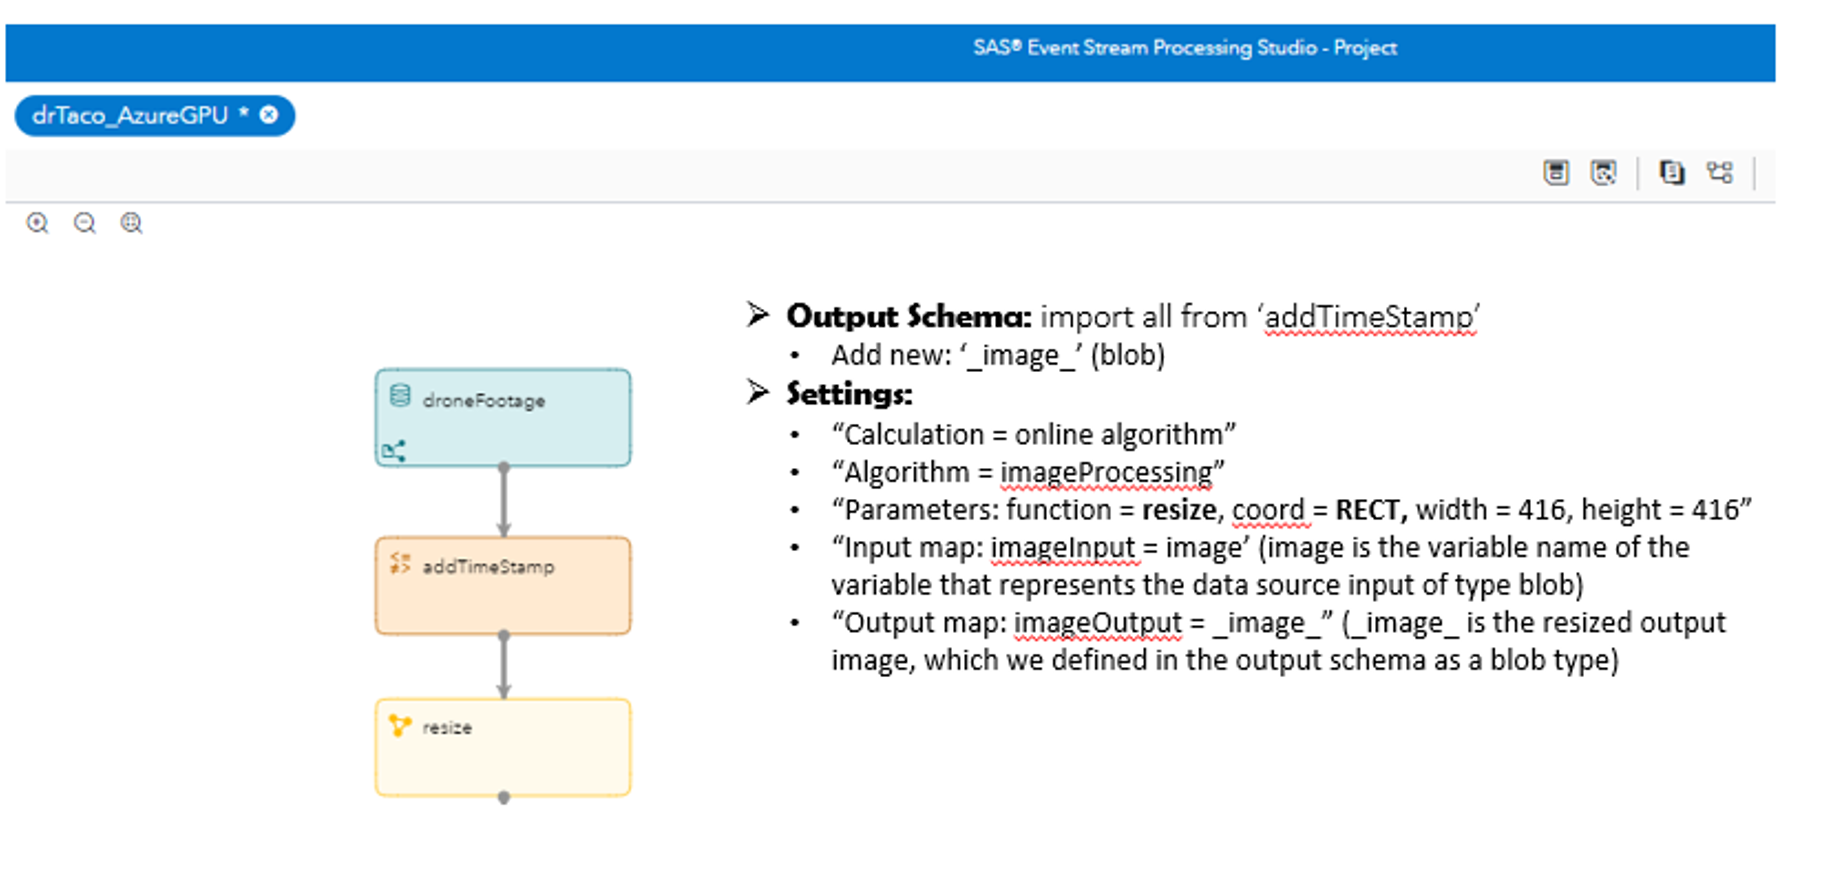
Step 2.3 - Calculate Window -3- ‘resize’
We need to resize each high-resolution frame to adhere to YOLOv2's maximum of 416x416. The Calculate windows support multiple image processing functions and 'resize' and 'crop' are 2 of the functions supported. To configure, add a calculate window and assign the following properties:
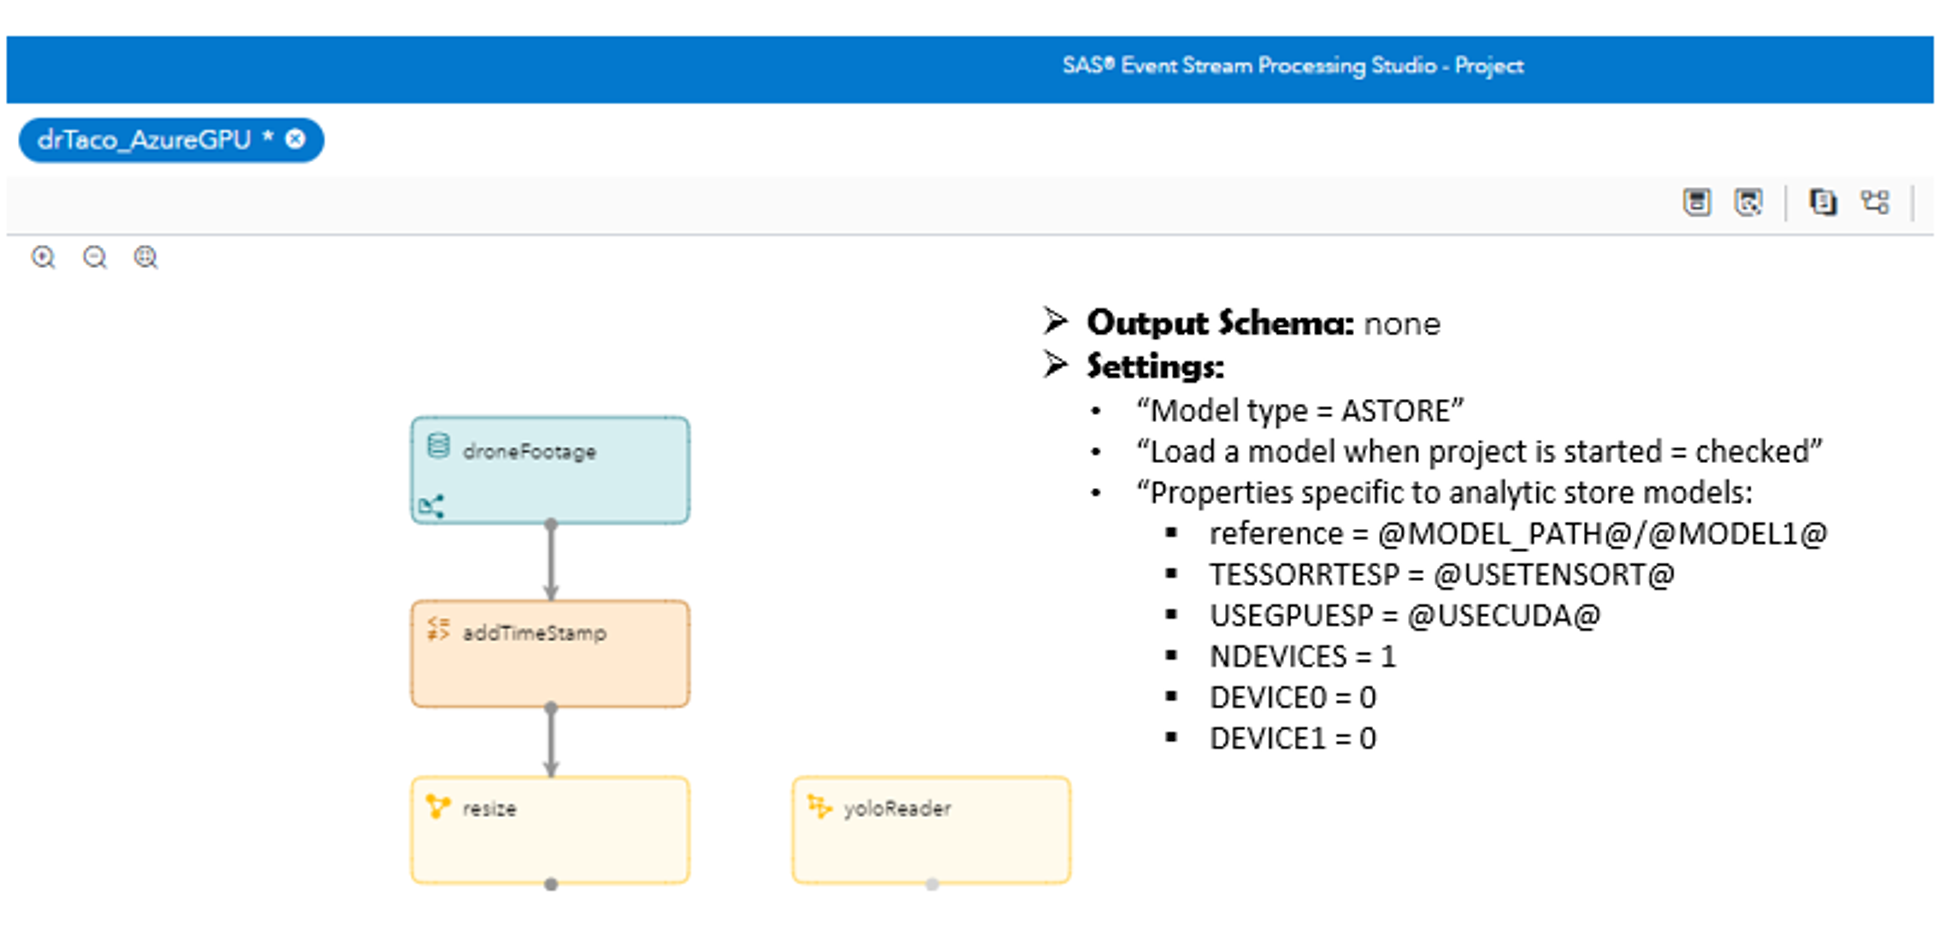
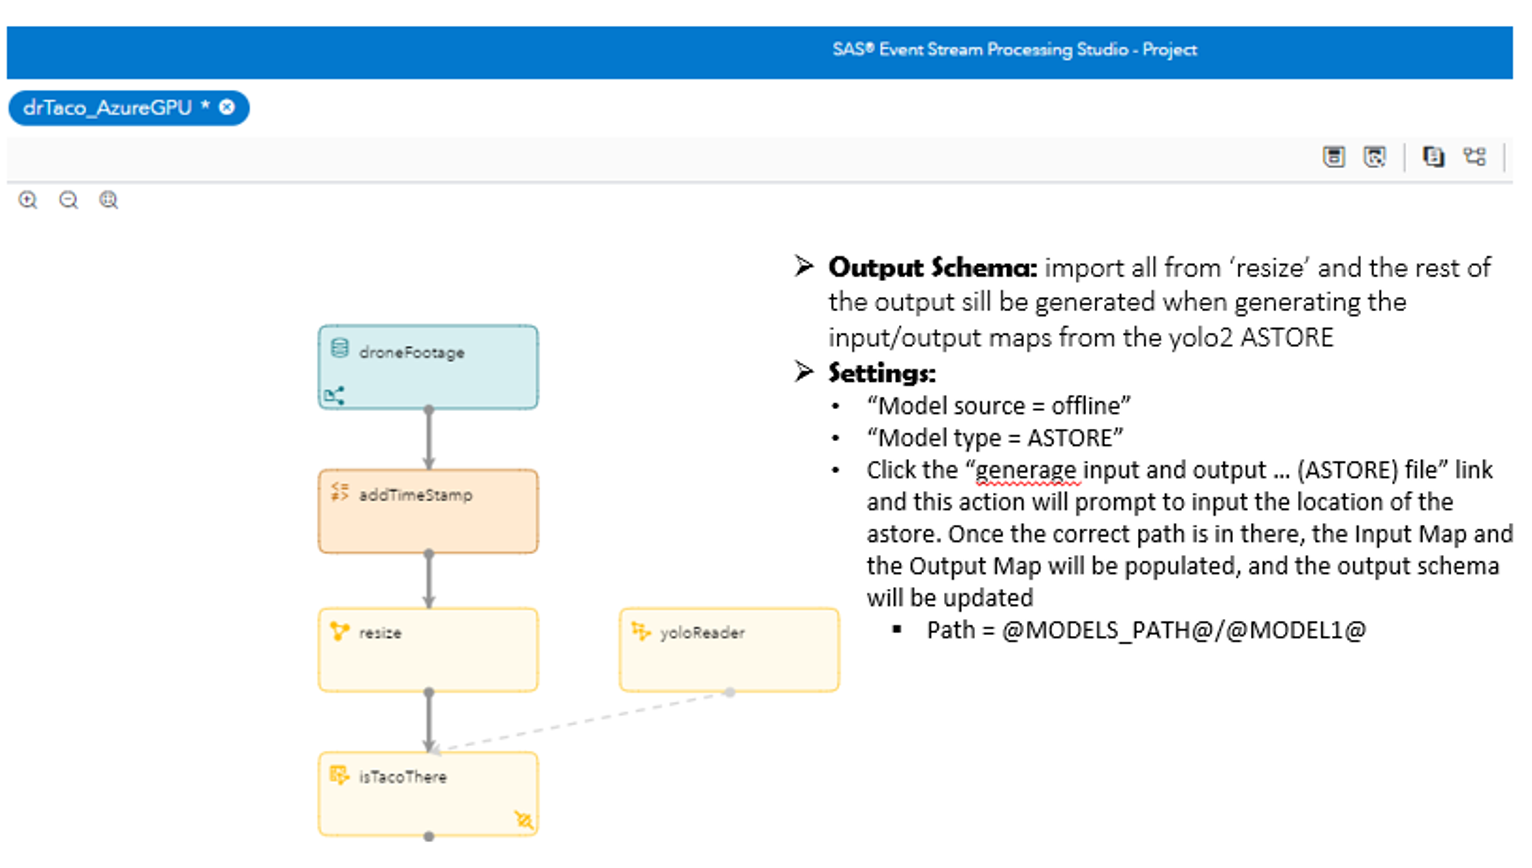
Step 2.4 - Model Reader Window -4- 'yoloReader'
This is where we configure the use of our first ASTORE model in the 2-stage model process. The YOLOv2 model will score and help us find Dr. Taco and put a rectangular frame around the 'event' in the subsequent scoring step. To configure, add a model reader window and assign the following properties:
Step 2.5 - Scoring Window -5- 'isTacoThere'
This is where we start scoring the video feed against our first model (YOLOv2) to find Dr. Taco. To configure, add a score window and assign the following properties:
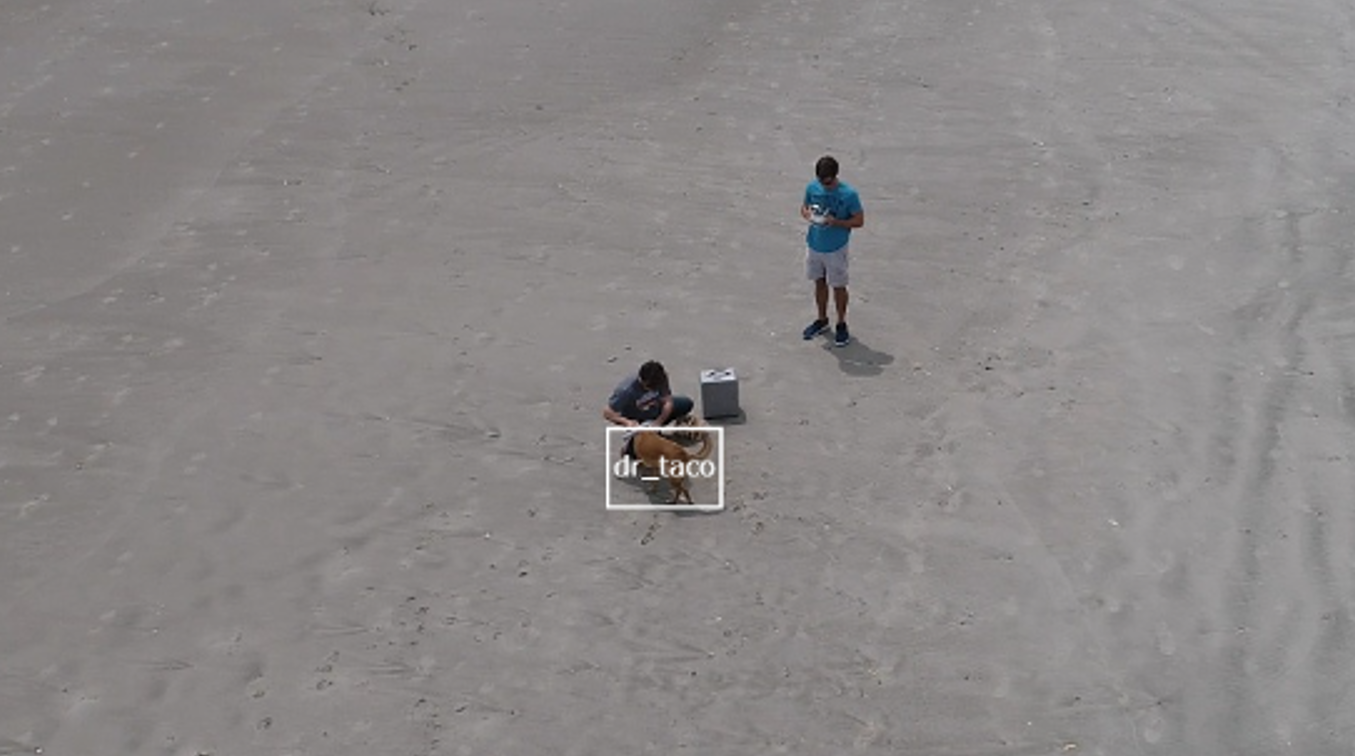
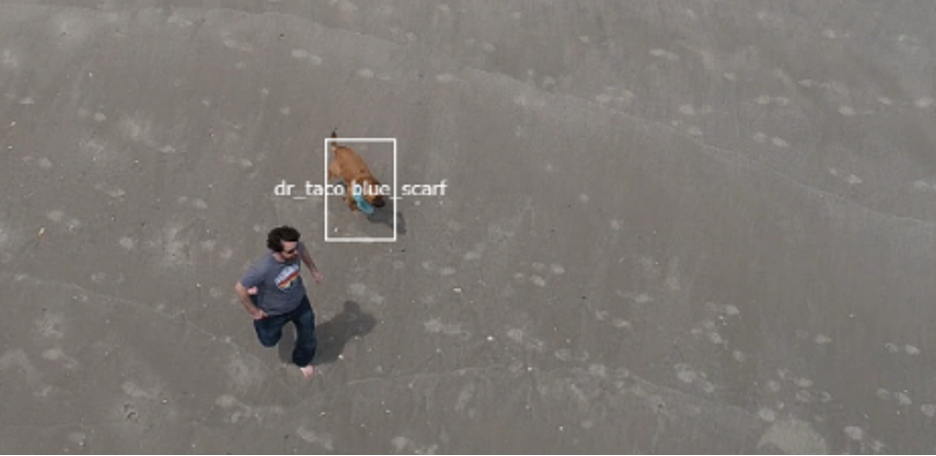
If we test our project now, we will be able to find Dr. Taco (thank you YOLOv2 model) and track him in the video stream:
![]()
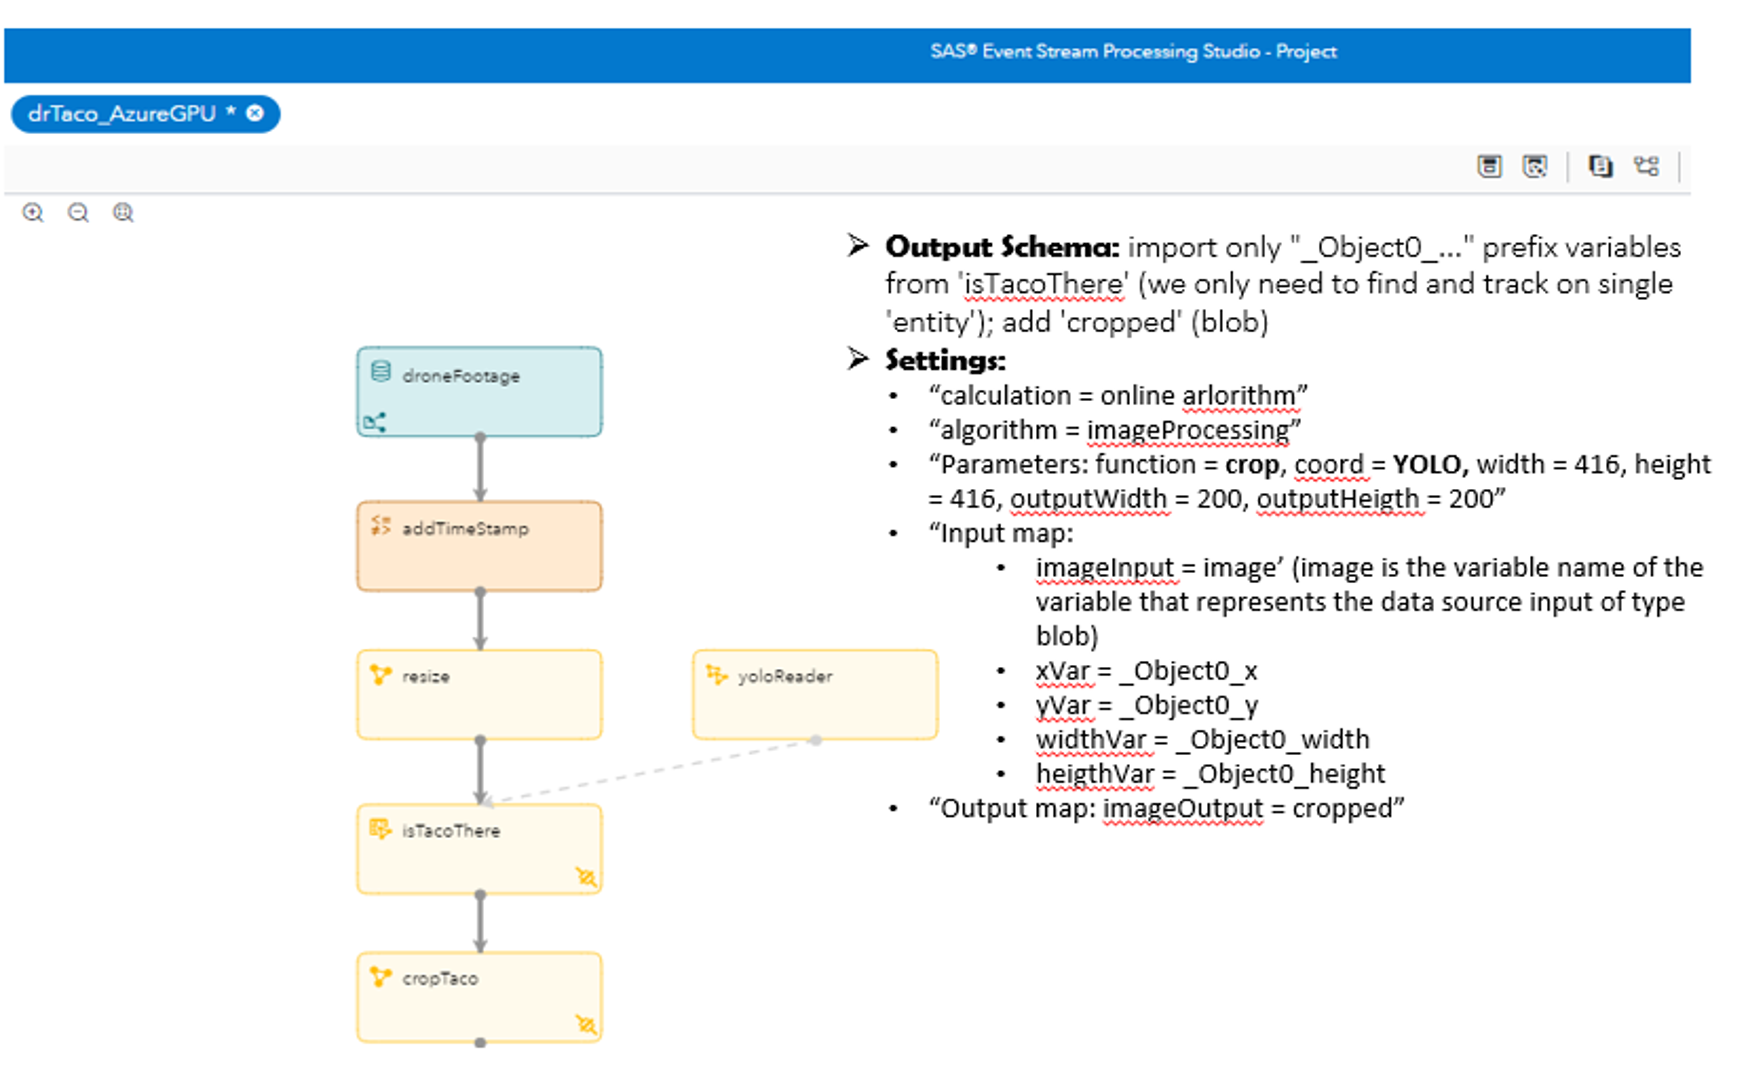
Step 2.6 - Calculate Window – ‘cropTaco’
Now, we need to crop out Dr. Taco around the rectangle frame identified and set up by the YOLOv2 model. We will use YOLO coordinates because it will normalize the data so we don’t have to worry about resolution. The Calculate windows support multiple image processing functions and 'resize' and 'crop' are 2 of the functions supported. To configure, add a calculate window and assign the following properties:
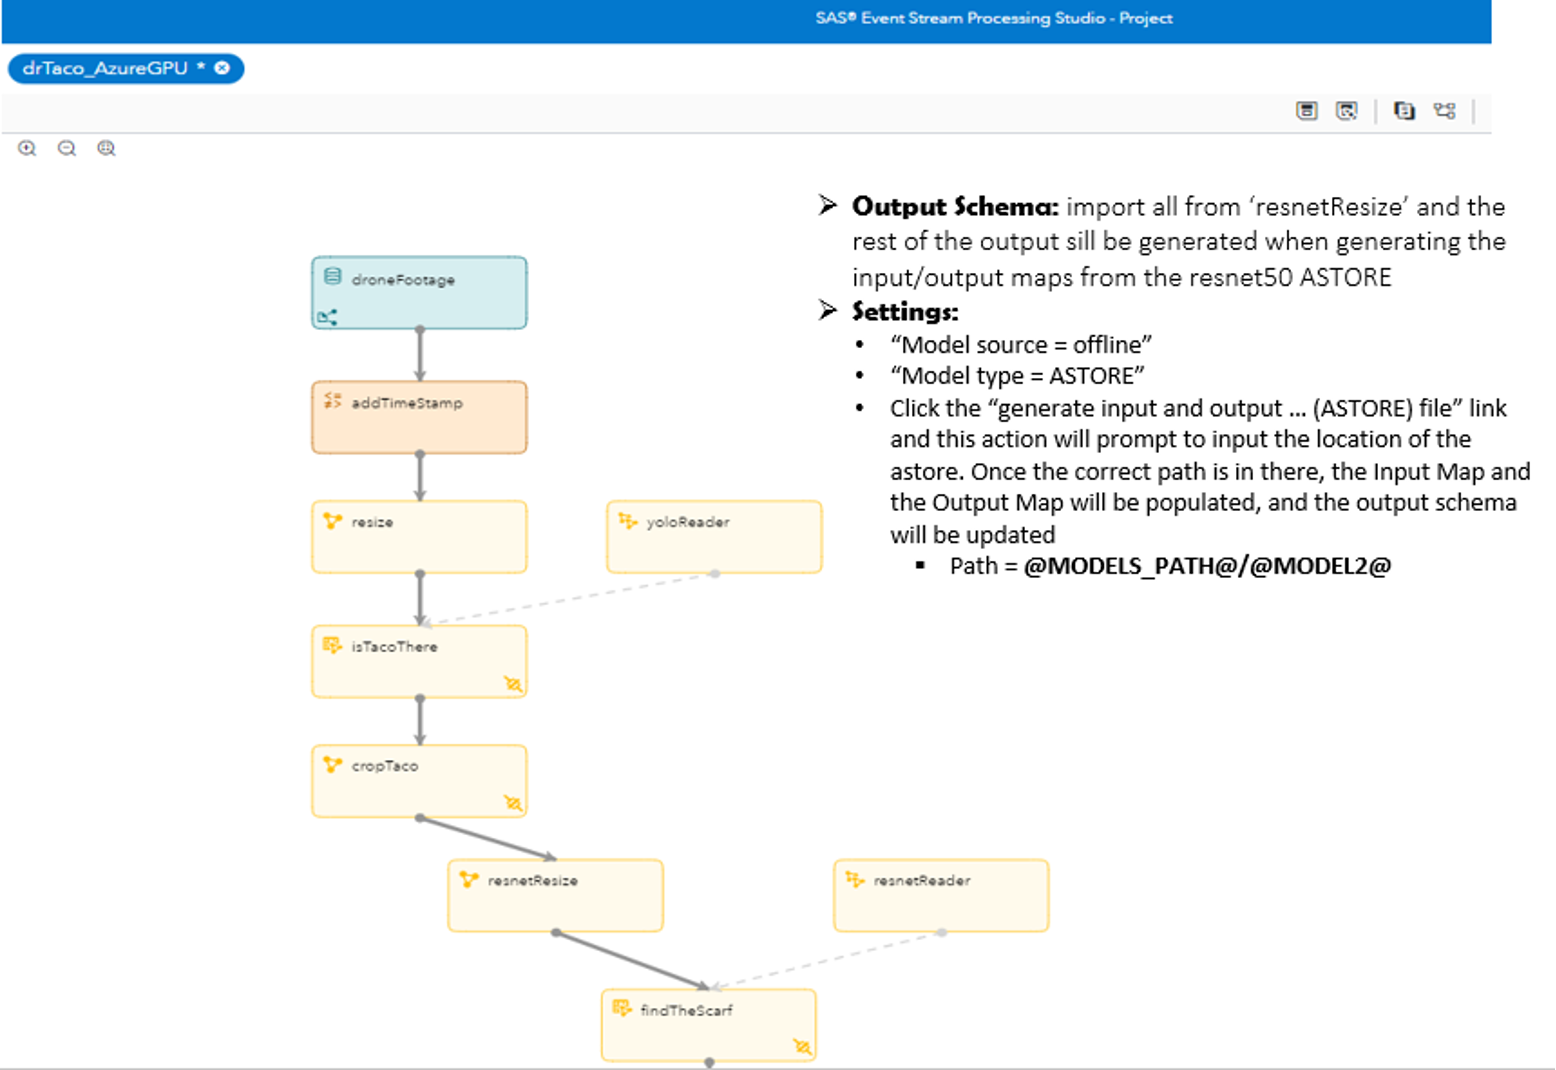
Step 2.7 - Calculate Window -7- 'resnetResize'
we need to resize each high-resolution frame to adhere to ResNet-50's maximum of 224x224 using the RECT coordinate type. The Calculate windows support multiple image processing functions and 'resize' and 'crop' are 2 of the functions supported. To configure, add a calculate window and assign the following properties:

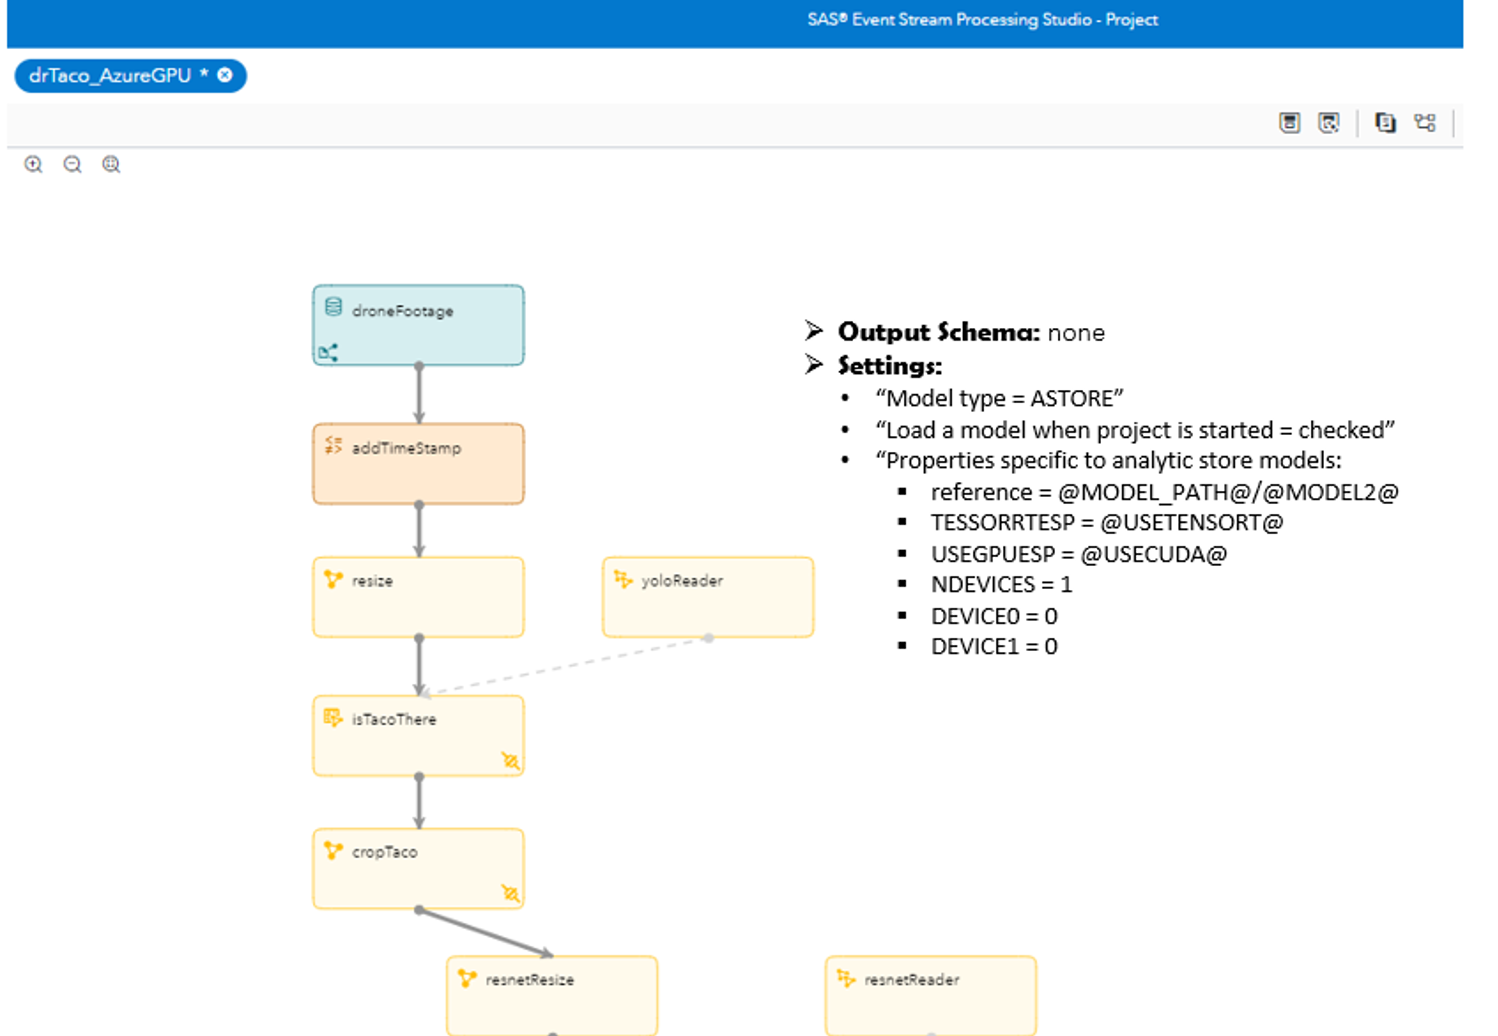
Step 2.8 - Model Reader Window -8- 'resnetReader'
This is where we configure the use of our second ASTORE model in the 2-stage model process. The ResNet-50 model will score and help us find what Dr. Taco is wearing and it will generate the second label for our annotation in the subsequent scoring step. To configure, add a calculate window and assign the following properties:
Step 2.9 - Scoring Window -9- 'findTheScarf'
This is where we start scoring the video feed against our second model (ResNet-50) to find the color of Dr. Taco's scarf. To configure, add a calculate window and assign the following properties:
Testing the model now and outputting the stream from the ‘findTheScarf’ window, we see still only what the YOLO model gives us: Dr. Taco without the additional annotation of the scarf color. To get the classification from the ResNet model on the scarf Dr. Taco is wearing, we need one more functional window in the project…
Step 2.10 - Functional Window -10- 'annotateTaco'
Apply a concatenate function between the labels of the 2 models: 'drTaco' and 'scarf color'. To configure, add a calculate window and assign the following properties:
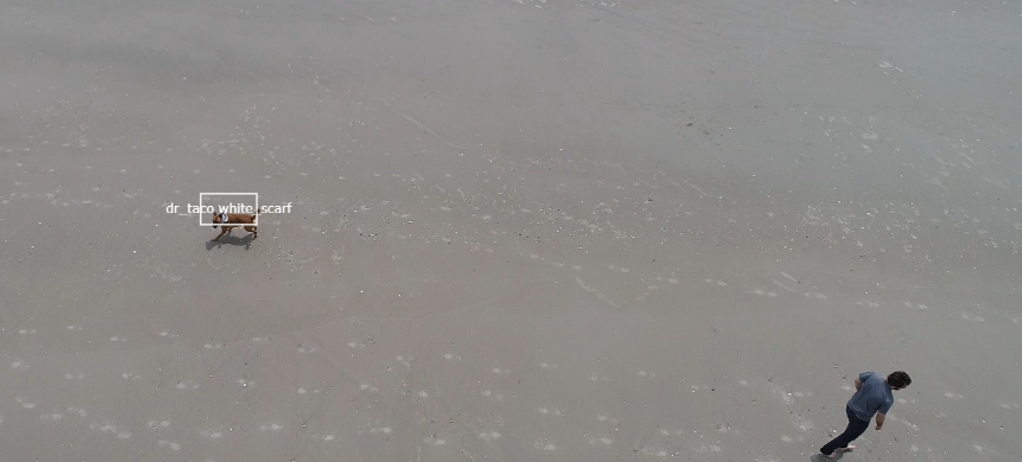
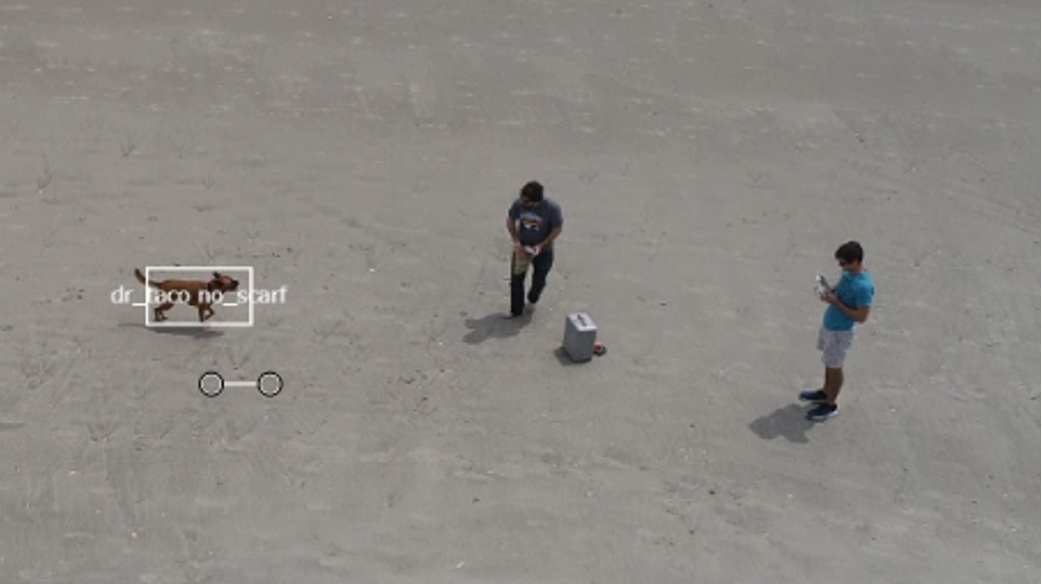
In the final test, we now know what Dr. Taco is doing!
Step 3: Testing
To test this ESP project before deploying it to stream and score through the webUI, we need a different data source. We will use the same 'droneFootage' source window, but we will activate the input data publisher connector that we defined earlier in Step 2.1 which will make the source a Base64 converted file of the screenshot created in Step 0. The Base64 file should be at this location - '…/ESPAssets/Input'.
Run test:
- Set publisher to 'Active'
- Enter test mode
- Run and monitor the source and the annotate windows.
Step 4: Running the ESP project
To deploy a new demo within the same infrastructure the IoT repo:
- All new assets will have been moved under "…/ComputerVisionUI" locations
- The ESP project XML file will need to be named 'Model.xml' and place under new folder location for the project under
“…/ComputerVisionUI/WebUI/Projects" (this should have already been completed in Step 0) - Important!!! Before exporting the project XML from ESP Studio, uncheck the 'Activate' option for the input publisher connector defined in the source window
- To add a new project to the webUI, make sure it can read from the new project Example
- Place videos to stream in the video source location under “…/ComputerVisionUI/WebUI"
Now, we are ready to run our project:
Final stream and conclusions
A quick recap:
- Neela and Robert used SAS Deep Learning technology to develop a 2-stage model to track down the thief Dr. Taco. They created a YOLO model to find and box-bind Dr. Taco’s activities. Once Dr. Taco was identified, they used a ResNet deep learning model to determine what Dr. Taco did by the color of the scarf he was wearing (we are going to great lengths to connect these dots; whatever color scarf Dr. Taco is wearing, that is the color of the chocolate that he stole).
- Once these models were developed, our expert modelers created the analytic stores of the models that they shared with me to implement and deploy through SAS ESP.
- To deploy those models, we first needed access to an ESP environment, and luckily, we have access to a couple. We have an ESP Engine on Edge container via a GPU-enabled Azure VM which gives us the option to experiment with GPUs or CPUs for processing the video stream. We also deployed ESP on Edge on a local container via Docker (no GPUs here though).
- We also have ESP Studio deployed in a local container which allows us to configure and connect to any ESP engine. ESP studio simplifies the creation of the ESP project, the deployment of the DL models and has point-and-click functions specific to manipulating and processing a video stream.
- Now, we are finally able to find Dr. Taco, track him and annotate his actions to the point that we now know exactly what he is up to.
Learn more
For more information on SAS Deep Learning and Event Stream Processing capabilities, please follow these links and don’t hesitate to contact us if you have any questions. Thanks for reading!