As populations around the world the U.S. continue to grow, both condensing in urban areas and sprawling in more rural areas, the importance of a functioning distribution network for utilities grows proportionally. The complexity and interconnected nature of say, the electric distribution network, is already staggering; one can hardly imagine what it may look like in ten years. The problem with a complex network, however, is the sheer amount of maintenance that it must undergo to stay functional, as a single malfunction may take down the network for an entire area. In the past, utility providers did not act on equipment deficiencies until after a malfunction occurred, but this reactive method of maintenance did little to prevent network outages and instead used them as a signal for repairs that could have and should have been handled beforehand.
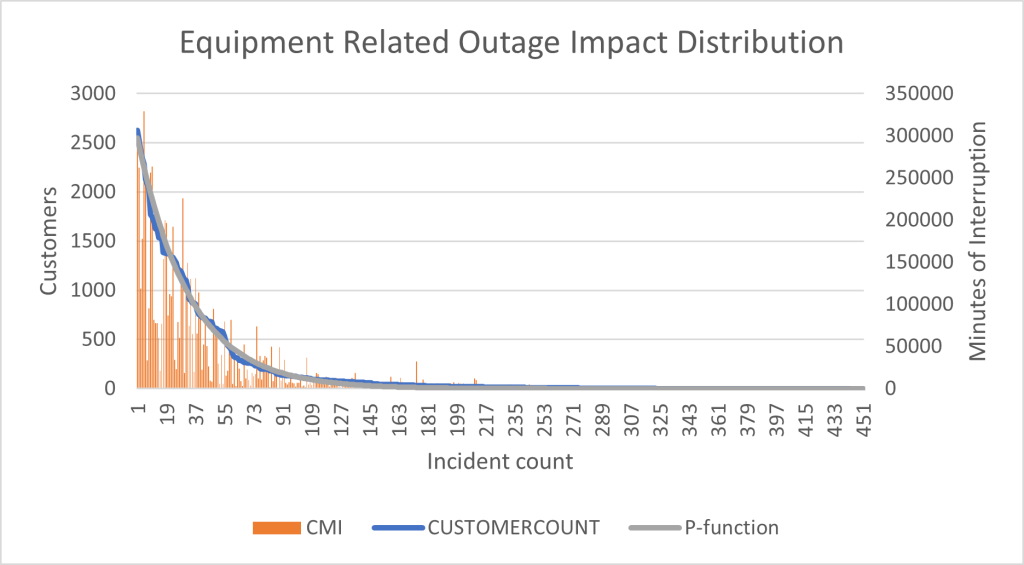
As described in our T&D World Article, SAS and our partner Exacter Inc. are helping utilities shift maintenance away from this reactive system towards a more efficient framework of condition-based maintenance (CBM). Although many of the utilities we work with immediately see the potential value, some also struggle with where to start to have significant impact with their initial efforts. To help formulate a meaningful approach to target the most vulnerable areas within a given operator’s overhead distribution network, it is first important to recognize the long-tailed nature of outage impacts. It is observed across nearly all electricity distribution operators that a relatively small percentage of the outages cause most of the Customer Interruptions (CI) as well as the Customer Minutes of Interruption (CMI) in any given year. In essence, power outage impacts are a phenomenon that very closely follow the Pareto Principle. As a rule-of-thumb, it is safe to assume that 80% of the customer impact arises from 20% (or less) of the outage incidents. Let’s look at a real-world example. The data in Figure 1 show a distribution of overhead equipment related outages in order of their count from a utility operating in the United States.

This data demonstrates that 12% (the top 54 of 451) of the equipment related outages in this operating territory over the course of a year accounted for 80% of the total Customers Interrupted as well as 75% of the total Customer Minutes of Interruption. This long-tailed distribution is also well represented by an exponential function in the form CI(n)=CImax⋅e−γn where:
n is a series of outage incidents in descending order by CI impact
CImax is the Customers Interrupted count from the most impactful outage in the series
y is the rate parameter estimated by CImaxCITotal
CITotal is the cumulative CI in the series of outages incidents
In Figure 1, the functional form of the distribution is labeled as P-function and has an R2 value over 0.99. The functional form of the incident distribution will be revisited later when we discuss estimates for benefits and cost of implementing CBM systems.
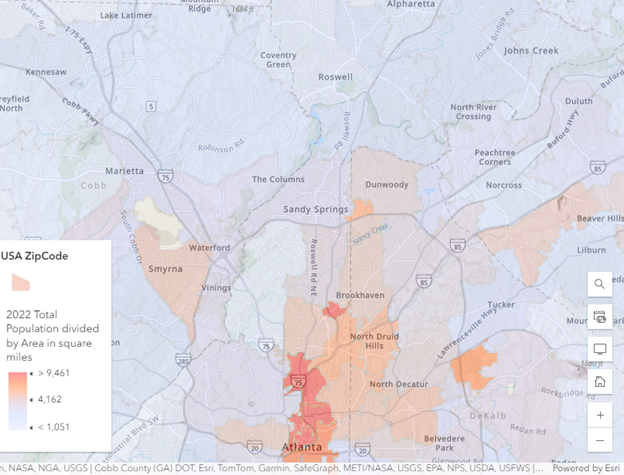
Figure 1 shows just one example of many utility data sets analyzed that demonstrate this same long-tailed nature over and over. This provides confidence that using the Pareto Principle and the 80-20 rule of thumb is a safe path to follow when assessing overhead equipment outage impacts. Knowing that 80% or more of the customer impact is being driven by 20% or less of the outages give utility operators an advantage when making decisions on where to launch new initiatives such as CBM approaches. This means that by setting up the new program on the critical 20% of circuits could yield as much as 80% of the expected overall impact. An additional advantage can be gained by looking at the intersection of these critical circuits with population or customer density. One view of population density is obtained by looking at the people per square mile in the zip codes possessing the critical circuits. One version of this information is available via ESRI ArcGIS within their USA ZIP Code Boundaries layer. If the utility has parameters for both customer count and circuit miles for all circuits in their distribution system, then the determination for density based on customers per circuit mile becomes a trivial task, and this parameter can be taken to further narrow the scope of the initial CBM system deployment.

By leveraging detailed data on both outages and customer densities, utility operators can be assured that they are focusing on the areas with the highest propensity for equipment related outages as well as the areas where the most significant customer impact will be felt if they don’t act early based on the condition of the equipment.
After establishing the best overhead circuits to focus on, the utility operator will need to justify the project by looking at the potential Benefit-to-Cost (B/C). We are applying a simplified approach for obtaining an initial B/C that leverages historical reliability performance (SAIFI* and CAIDI**) to project or simulate the equipment related outage impact described in Figure 1. We will save the details of deriving the simulated distribution function parameters for a future article.
Let’s step through the approach for an anonymous utility with median performance SAIFI and CAIDI excluding Major Event Days (MED).
Parameters for Anonymous Utility Company
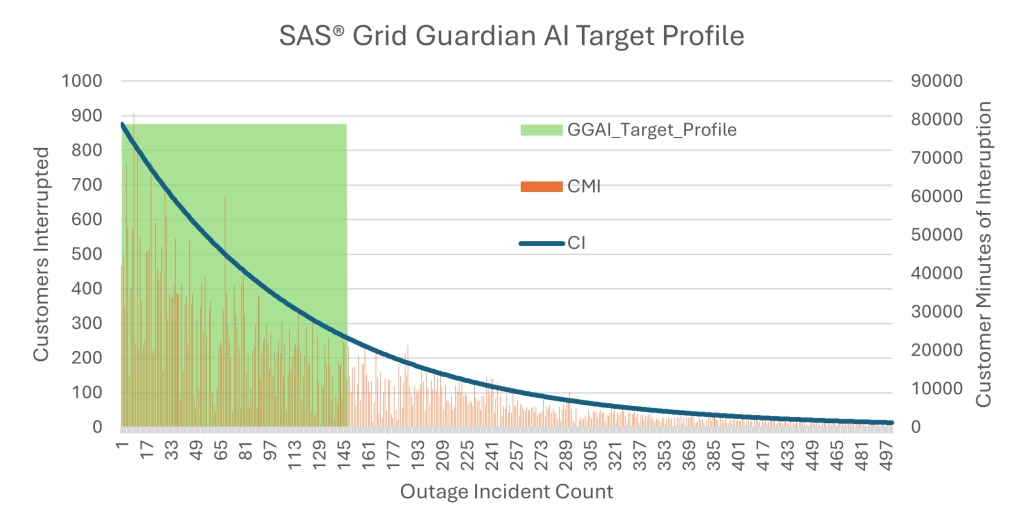
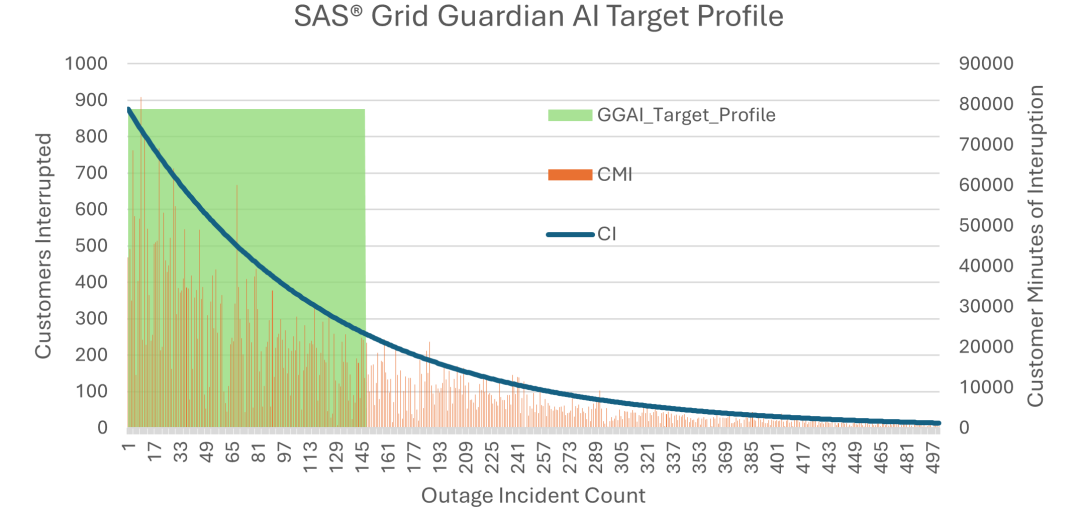
The utility operates 2 of their 3 territories comprising approximately 400 circuits and 325,000 customers for improving reliability performance. We then build out the simulated outage impact profile using estimates generated from reported SAIFI and CAIDI performance as illustrated in Figure 3.

By setting a goal of capturing 70% of the CI (illustrated by the shaded green section in Figure 3) within the continuously monitored footprint of the CBM system deployment, the resulting circuit count is 55. By focusing initial CBM deployment in this area (55 of the 400 circuits in the territories of concern) the utility operators will have condition-based assessment insights to act on up to 70% of the potential equipment failures before they happen. We even have a historical database of condition-based assessment findings accumulated over more than a dozen years to help us estimate the specific findings we would expect annually in the target area.

It’s safe to assume that the utility operator will not be able to make proactive replacement of 100% of the equipment detected prior to failure. We make a conservative assumption that one third of the 264 items identified will become part of a proactive planned outage replacement. This would lead to 87 unplanned outages being avoided and the reduction of nearly 18,000 CI and 910,000 CMI year over year. In working with many utilities, we have seen a range in value of a minute of CMI savings from $0.75 to $2.25. In sticking with a moderate value of $1.75 for this case, we land at approximately $1,600,000 in Operations and Maintenance (O&M) Savings. On the cost side, at an average cost of $3,000 per planned outage we arrive at $261,000 in planned outage cost. We add to this the estimated cost associated with the CBM system deployment in this footprint at $680,000 and we land at total investment of $941,000. As this cost can be tied to a program for grid reliability program, we have been successful in helping utilities capitalize the cost of the CBM system. The punch line here is that we have a B/C ratio of 1.7 and that the investment is on the Capital side while the reductions are on the O&M side. LEARN MORE | Learn more about SAS Grid Guardian AI's capabilities
*System Average Interruption Frequency Index (SAIFI)
**Customer Average Interruption Duration Index (CAIDI)


