[Editor’s note: this post was co-authored by SAS’ Tom Sabo.]
Narrative data from police agencies on arrest or offense incidents, as well as tips to police departments, is both rich in information and also largely unavailable to the public for analysis. That said, recently came across ~45,000 unique narratives describing police incidents occurring in the city of Dallas, TX available on https://www.dallasopendata.com/.
Assessing large quantities of narrative data for patterns using manual analysis alone can be time consuming and produces limited qualitative results. We set out to demonstrate how modern methods in text analytics can assist. In particular, we wanted to uncover actionable textual and geospatial patterns related to counter human trafficking (Figure 1) and other crimes.
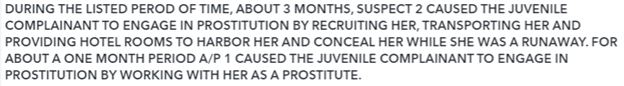
Figure 1. Example narrative incident
To address this, we needed to think critically about improving the existing process with technology. In particular, this involved providing capability that individuals who work day-to-day in police work would benefit from rather than an analyst or data scientist. Ultimately, we sought to improve time-to-value for police investigators by using text analytics to highlight trafficking-related incidents and other crime patterns, then providing intuitive access to these through visual dashboards. Fortunately, text analytics methods we’ve applied elsewhere that auto-categorize data and look for trends, entities (people, places, objects) and connections between these work very well on police incident narratives.
This workflow and approach can be seen below in Figure 2, which details the overall process and analytics applied to the police incident narratives. The narrative text was passed through the GUI-based text pipeline, which applied common and industry-standard NLP (Natural Language Processing) and Text Analytics approaches, such as topic analysis, entity extraction, summarization, profiling of the text data and more. This pipeline-based approach results in standardized, analytic-ready tables that we fed into Visual Analytics to explore, investigate and visualize the results of our analysis. This process provides a huge time-to-value in terms of extracting crime-relevant information from vast narrative data which would be of immediate use to police investigators. For this process we identified patterns of theft, violence and human trafficking in minutes from the 45,000 narratives.
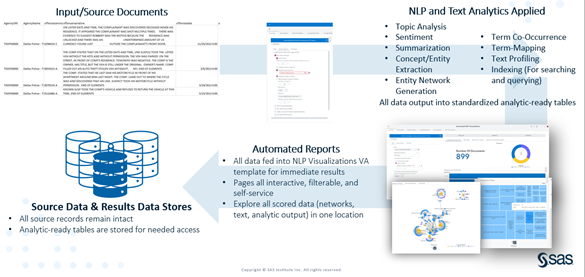
Figure 2: Text analytics workflow and approach
Much of our results were based on rules we developed using SAS Visual Text Analytics, essentially defining ways to extract these crime patterns mentioned above and more. A set of concept rules and open-source integration was utilized to extract, geocode and categorize locations by type. To accomplish this, a rule was written that extracted street addresses. This rule used a combination of street numbers, street words (Avenue, Street, Drive, etc.), directional indicators (N, S, E, W) and filler words that represented the literal street name. Using this, we were able to filter incidents that occurred adjacent to schools as shown in Figure 3.
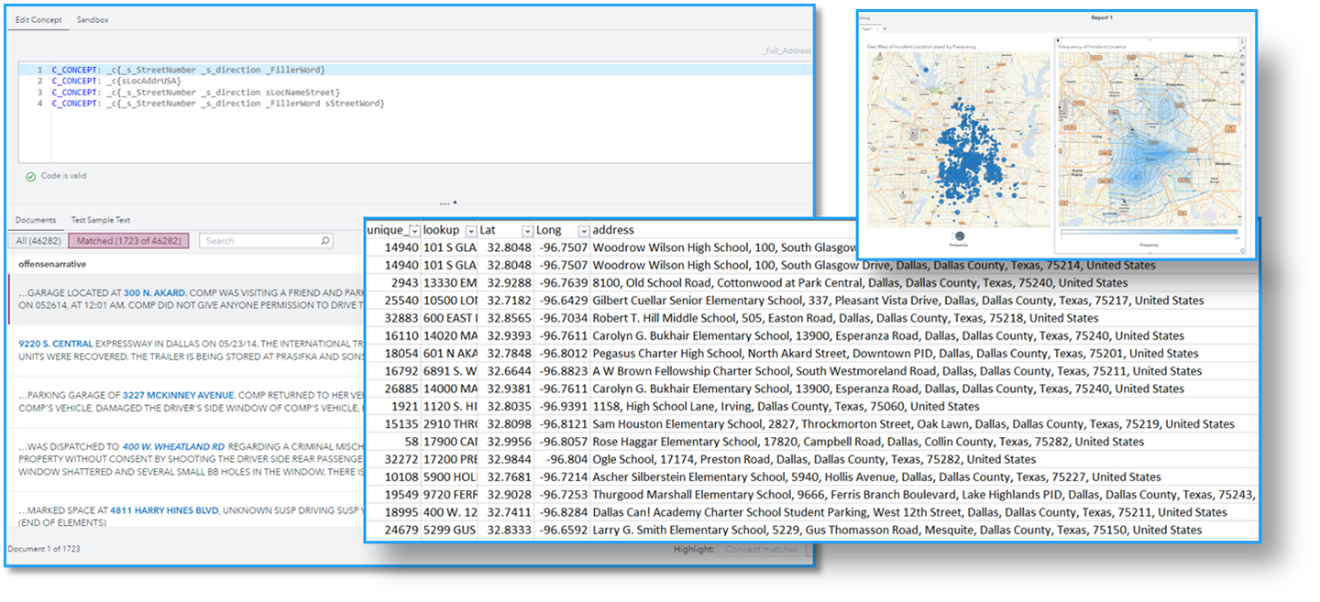
Figure 3: Geolocation concept rules and resulting analysis
After extracting the full street names, they were passed through a Python process (using geopy) that produced a latitude and longitude for each address. The resulting coordinates were then reverse geocoded. This was performed to retrieve the address back from the newly discovered coordinates. This was done to get a more verbose address back from the process.
Example Address Geocoding and Reverse Geocoding:
- Original Street Name: 920 SAS Campus Drive Cary, NC 27513
- Geocoordinates: 35.815658, -78.749284
- Reverse Geocoding: SAS Global Education Center, 920 SAS Campus Drive Cary, NC 27513
As seen in the preceding example, performing reverse geocoding may yield additional information such as the hotel, gas station, school or other key names for this address. This additional information enabled us to group the extracted locations into a VTA-created taxonomy that classified the locations by type. We constructed ~10 locations for this project, including gas stations, restaurants, hotels, and schools, among others. When combined with additional analysis, this additional categorization is useful and provides new structured fields to act as entry points for analysis with Visual Analytics. This additional entry point enabled exploratory analysis and the rapid discovery of interesting insights. One example is locating a gun-related robbery that occurred in front of an elementary school. We were able to geospatially target and categorize the unstructured narrative to a time, place and event-type by geocoding, assessing the type of location, and extracting weapons, assisting investigators and increasing analyst efficiencies.
Additional rules were developed within VTA to extract vehicles from the police incident narratives. This rule utilized a combination of key features of a vehicle, such as color, make, model, year, type, and key descriptors of a vehicle. By looking at the combinations of these characteristics, we extracted many vehicles from these narratives and provided additional and helpful information as you drill into narratives and look at trends across the corpus. Examples of the vehicles identified in narratives are shown in Figure 4.
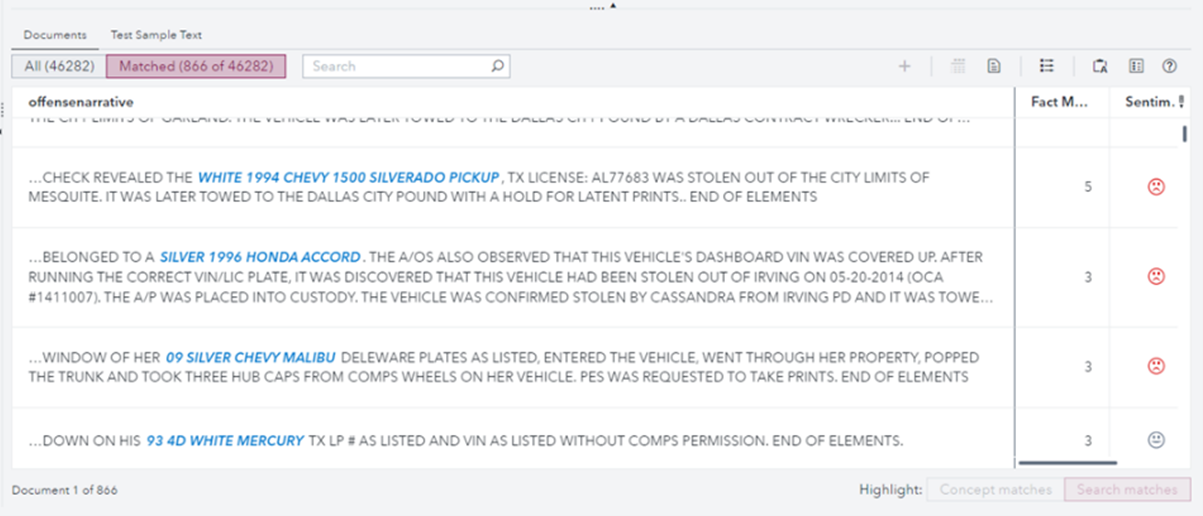
Figure 4: Vehicle extraction
Many extracted concepts are shown in the network diagram (Figure 5) below as they relate to their source documents. The blue nodes are the source documents, the yellow nodes are addresses, and the orange nodes are weapon mentions. This visualization enables users to quickly examine overlaps, trends, and potential modus operandi across the 40k narrative reports. Many of the linkages and overlaps would be impossible to detect through manual human review without the aid of concept extraction and visualizations. Numerous examples of potentially interesting trends can be seen in Figure 5 below. We can see multiple narratives about a 2005 White Chevy Van, for example. This could indicate a trend for this vehicle and warrants further examination of the source narratives. Another example is examining the frequency and trends with which specific weapons or addresses are referenced across reports.
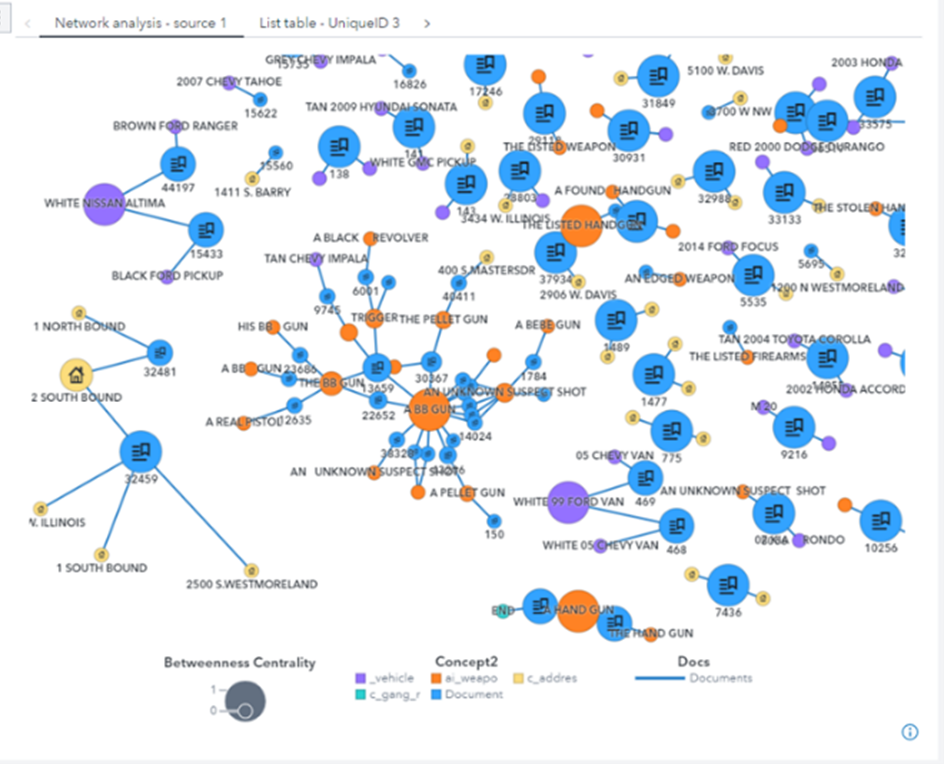
Figure 5: Network-based exploration of extracted concepts in SAS Visual Analytics
Rules related to human trafficking were developed using AI and statistical methods in SAS Visual Analytics to identify patterns around known entities of interest. For instance, in Figure 6 below, by looking for similar terms to “prostitution” in the narrative dataset, we immediately identify related terms to trafficking including “harbor”, “recruit”, and, in particular, “juvenile complainant.”
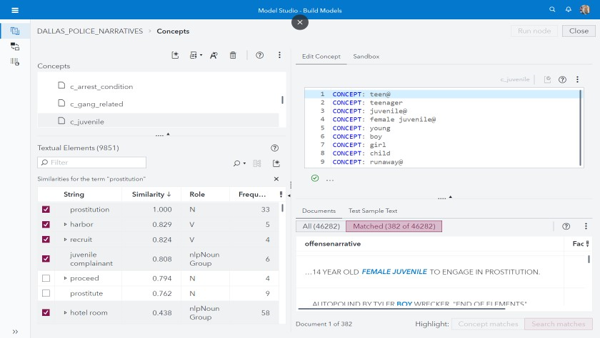
Figure 6: Using SAS Visual Analytics to identify terms and incidents related to human trafficking
From here, using AI methods and additional rules related to threats, coercion, blackmail and runaways, we were able to flag narrative incidents that highlighted human trafficking directly (as in Figure 7 below) or highlighted risky situations such as physical violence against women/teens that could either be related to human trafficking directly or could create a trafficking situation in the future.
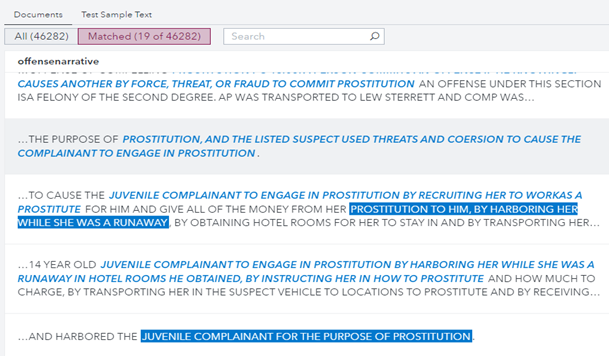
Figure 7: Flagging statements within narratives that are indicative of human trafficking
Putting it all together, we could use the geospatial methods discussed earlier to highlight those narrative incidents involving human trafficking or a risk of human trafficking to make these available for investigation as in Figure 8 below. This is intended to be an intuitive dashboard that an investigator or police officer could leverage.
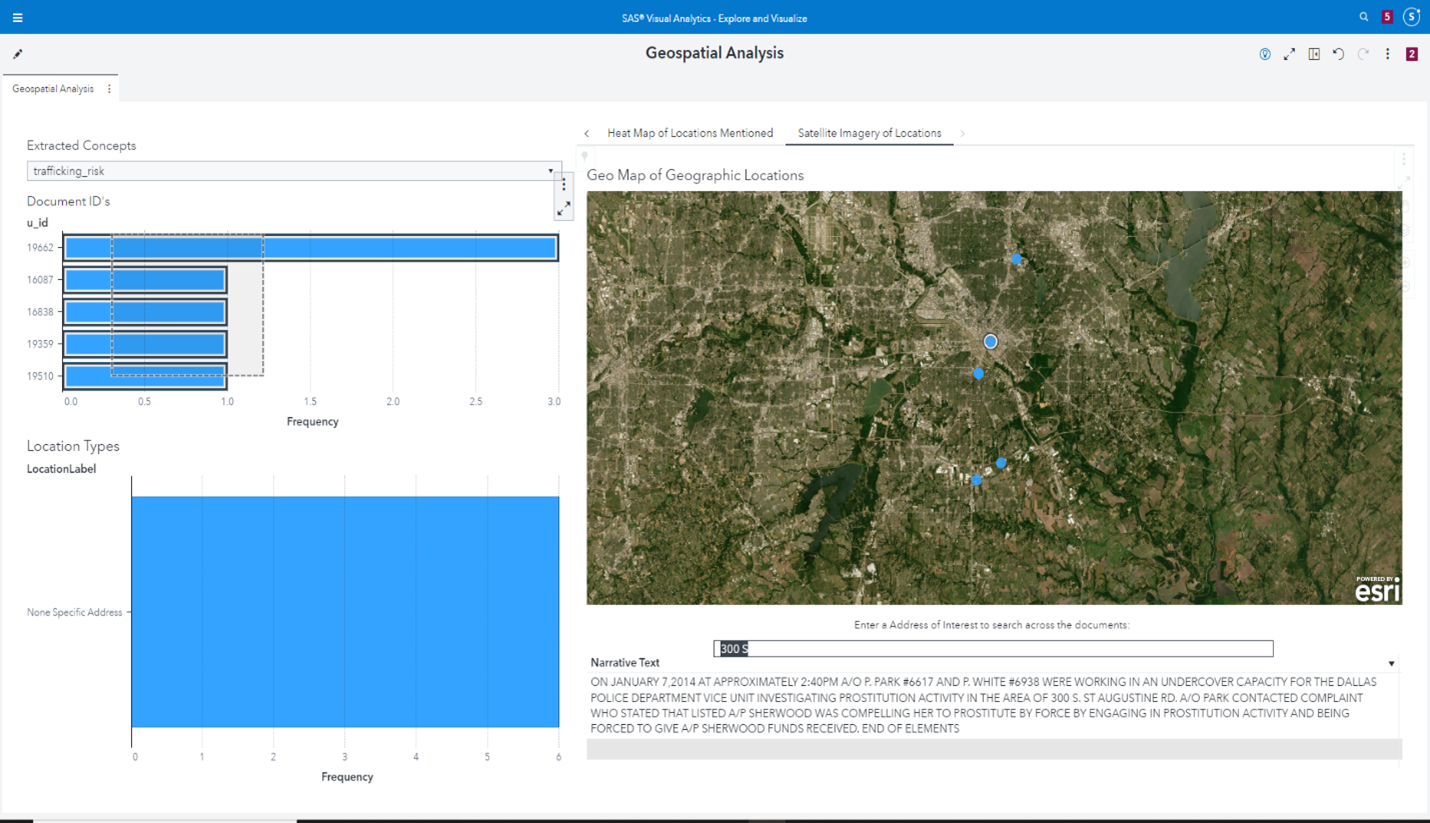
Figure 8: Geospatially plotting narratives containing or at risk for human trafficking
In summary, our aim was to showcase how given minimal structured data, we leveraged text analytics capabilities to identify patterns in narrative data that could be assessed in intuitive ways. While police departments have additional metadata related to these narrative incidents, it is possible that such metadata only allows for a primary offense, such as a drug abuse incident, while there are indications in the narratives of a secondary issue, such as human trafficking risk. Additionally, similar methods could be leveraged on textual or transcribed tips and other textual data sources of investigation to help filter, classify, and route these leads appropriately for quick action.
Learn more
- Check out additional documentation on writing concept rules and for Visual Text Analytics.
- Keep exploring by checking out the Make Every Voice Heard with Natural Language Processing e-book or visit Visual Text Analytics.