In this post, we examine a network data set study released in 2002 that documented efforts identifying influential users in a social network. The goal of the study was to find the most connected social network users who used drugs themselves and train them as peer educators to help reduce needle sharing and other high-risk behaviors among drug users. The study wanted to find the fewest number of peer educator candidates that could reach the greatest number of other users in the network. To achieve this, the 2002 study utilized degree centrality measures, supplemented with demographic, gender, and racial attributes. Our study demonstrates three methods to find peer educators using only anonymized network data.
Hartford drug user social network
In their 2002 paper “Social Networks of Drug Users in High-Risk Sides: Finding the Connections,” the authors presented a social network of drug users in Hartford, CT. The research team collected data through interviews with a community of drug users. Users provided information about the types of drugs used, needle-sharing activities, recency of usage, and demographic information such as age, gender, race, and housing status.
The research team then built a directed network (one in which node connections have a known direction) from the data, where links represented needle-sharing. See Figure 1.
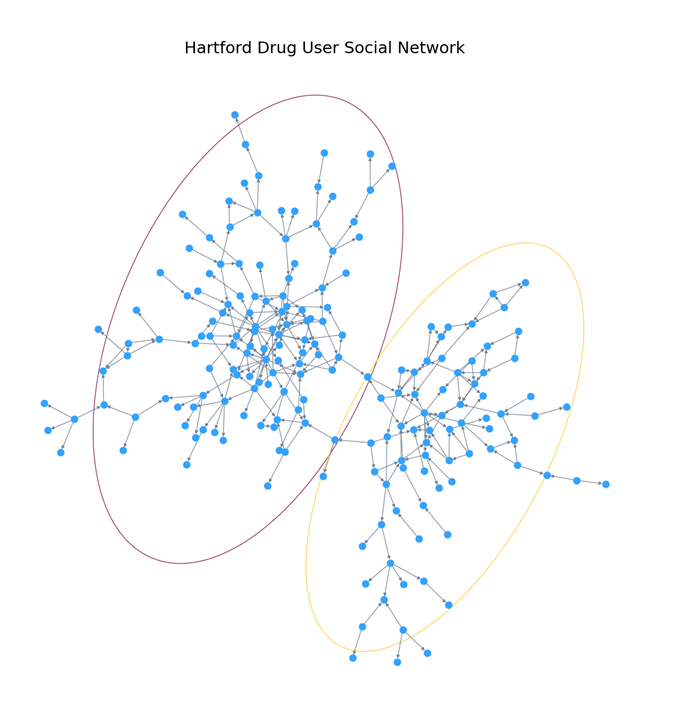
The team chose to focus on the largest connected component, which represented connections between 193 individuals. This component was later released as an anonymized data set representing links from and to terminals. Each user was assigned a unique number between 1 and 193. So, the primary information content of this network existed within the linkages. The network itself, while connected, was sparse. There were 273 links between nodes. The density was only 0.007. Network density, which ranges from 0 to 1, is defined as actual links divided by potential links. The average links per node was only 1.4. 80 of the 193 nodes were leaf nodes. This means they contained in-links but no out-links.
A network diagram representing only the raw network is shown in Figure 2. Initial examination of this network shows that the fully connected component is a set of two loosely connected components. In Figure 2, each subcomponent is enclosed by ellipses. The network can be further divided into smaller subgroups, which is described later in Method B.
Three methods to identify influential users
In our attempt to identify important users in the network, we chose three approaches to identify potential peer educator candidates. Once the candidates were identified, we tested their influence by calculating each candidate’s reach (ego) network over two hops. Simply put, we defined a peer educator’s potential influence by counting their friends, and friends of friends. This differs slightly from the efforts of the original 2002 study. Their team relied only on direct (one-hop) connections. Two-hop reach networks were chosen because we didn’t have access to key data available to the original authors. In each method, we attempted to minimize the number of peer educators necessary to reach half of the network (97 nodes).
Method A: degree centrality influence
The first method we used to identify peer educators was the simplest. Here, we attempted the methods of the original study albeit without some important information about relationships that were used in the paper. For our tests, we could only look at the degree centrality of individual nodes. Degree centrality is a simple-to-understand measure that defines a node’s importance. It is found by counting the total links (both from and to) for each node. A higher degree centrality indicates greater importance.
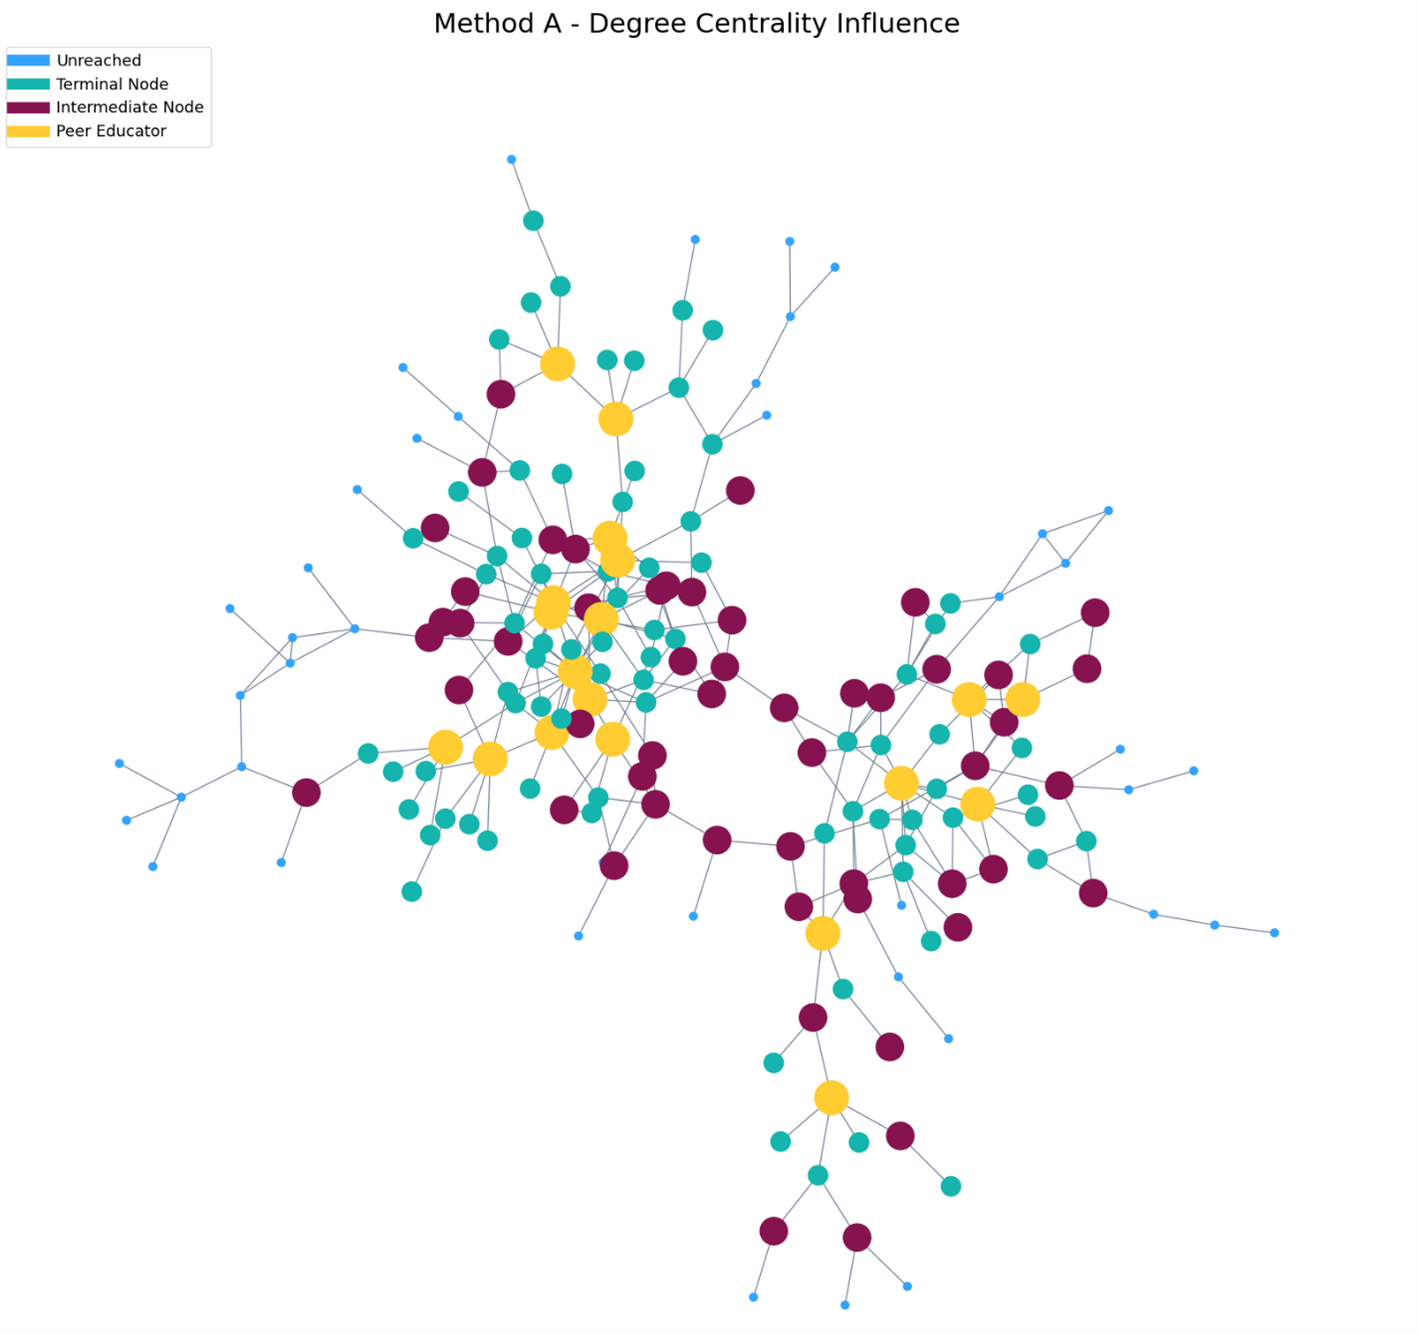
We can separate total degree centrality into two categories. The first is in-degree which counts links pointing to a node. The second is out-degree which counts links originating from a node. In our case, we defined a “good” candidate as someone who has a high total degree centrality and a high out-degree centrality. In our test, we identified 19 potential peer educators who have at least five total connections, as well as at least four connections that originate from the node.
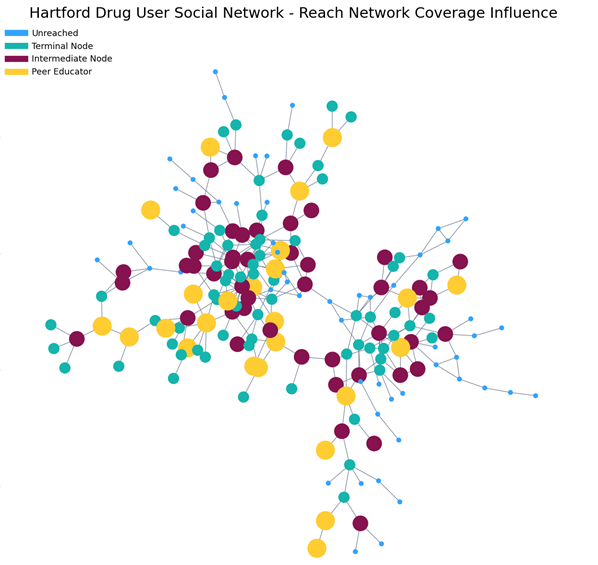
After calculating the two-hop reach (ego) network, we found that these 19 peer educator candidates could potentially reach 132 additional users. This gave us a total network coverage of 151 nodes. Figure 3 shows the extent of influence from the selected peer educators.
Method B: degree centrality within the community influence
The second method refined the first approach by first estimating the communities present in the network. Then we calculated the most “important” nodes within each community from the degree centrality.
For community detection, we used the Louvain method. Then we tested various total community assignments. See Table 1. After reviewing the results, we chose an arrangement that returns five communities, as shown in Figure 4.
| Resolution | Communities | Modularity |
| 1.5 | 16 | 0.722 |
| 1.0 | 12 | 0.727 |
| 0.5 | 7 | 0.675 |
| 0.25 | 5 | 0.630 |

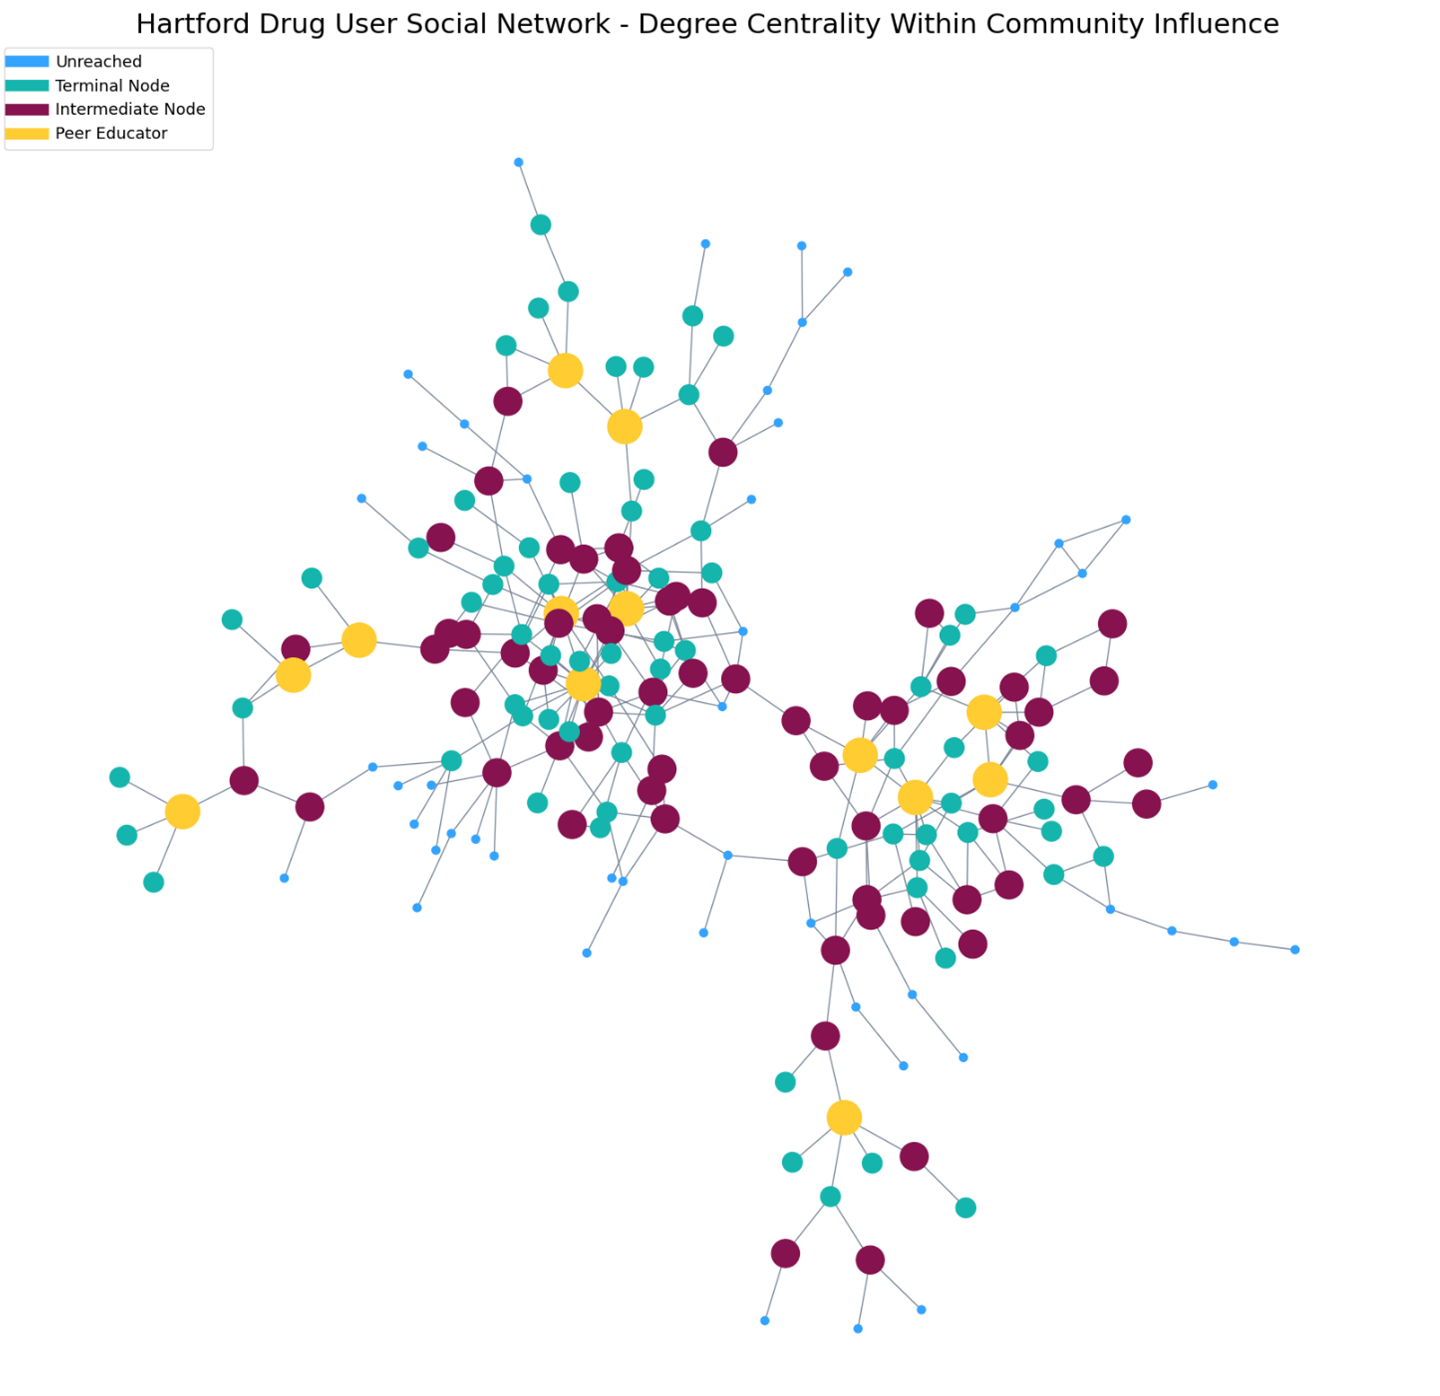
Once community detection was completed, we proceeded with the selection of peer educator candidates. We again used degree centrality as the primary tool to determine influence. For each community, we determined the distribution of out-degree centrality among the community members. In each community, we standardized by z-score and calculated the kernel density estimate as well as the cumulative distribution (CDF) function. From the CDF we derived a score for each node between 0 and 1. Any node with a score of at least 0.85 was selected as a candidate for peer educator. As in Method A, we then calculated the two-hop reach (ego) network for these candidates and determined their total potential influence on the network.
Method B identified 13 peer educator candidates who could potentially reach 133 additional users for a total network coverage of 146 nodes. Figure 5 shows the extent of influence from the selected peer educators.
Method C: influence potential based on two-hop reach networks
In Method C, we used a different approach to identify peer educator candidates. Instead of degree centrality, we first calculated all two-hop reach networks over all nodes. We then submitted these networks into an optimization solver to determine the fewest peer educators that could influence at least half of the nodes in the network. We used the SAS documentation example Reach Networks for Computation of Market Coverage of a Terrorist Network as inspiration.
Relying on reach networks only, Method C identified 25 peer educator candidates who could potentially reach 114 additional users. This gave us a total network coverage of 139 nodes. Figure 6 shows the extent of influence from the selected peer educators.
Results
Table 2 shows the peer educator candidates and potentially reached users for each of the three methods described above.
| Method | Peer Educators | Users Reached | Total Reached | Users Not Reached |
| Degree Centrality Influence | 19 | 132 | 151 | 42 |
| Degree Centrality within Community Influence | 13 | 133 | 146 | 47 |
| Two-Hop Reach Network Influence Potential | 25 | 114 | 139 | 54 |
Recall that the original study attempted to minimize the total number of peer educators while reaching the most users in the network. They identified 13 candidates who could reach 97 other users in the network. This would be equivalent to reaching 50% of the network. We were unable to match their methods directly. However, Method A (degree centrality influence) represents the closest approximation to the original study. In our case, Method A identifies 19 candidates who could reach 132 others in the network. Method B has a slightly smaller total reach (146 users as opposed to 151 for Method A). But it achieves this with only 13 peer educator candidates. In Method C, when only two-hop reach networks are considered, then optimized for as close to 100% network coverage, we find that 25 candidates can only reach 114 individuals.
Of the three methods presented here, only one node (115) was identified as a peer educator candidate by all three methods. Methods A and B identify seven common peer educator candidates (nodes 115, 27, 34, 43, 61, 69, and 77). Methods A and C share only three nodes (115, 28, and 53). Unfortunately, peer educator candidates identified by the original study authors are not available, so we cannot directly compare our results with theirs.
Summary
This post attempts to replicate results from a 2002 paper that identifies connections between drug users in Hartford, CT. In the paper, peer educators are identified by a combination of network analytics methods and prior known information about demographics, gender, race, and behaviors. In our study, we used only network analytics methods without the inclusion of information that could introduce bias into the results.
Even though we were unable to directly replicate the results from the study, the three methodologies shown provide similar network coverage to the original results. This indicates that it is possible to use only mathematical techniques to identify peer educator candidates in a social network. Method B generated the most favorable results of the fewest peer educators that reached the most members of the network.
The analyses for this post were developed using SAS Viya, Jupyter, and Python. If you are interested in learning more about the technical details of this post, and seeing the code used, go to the SAS Software Network Analysis Github repository. This specific example is located in applications/Hartford.