Random act of kindness
At a Starbucks in Florida in 2014, a woman drove up to the window. She was feeling magnanimous because someone had just done something special for her. On a whim, she decided to pay for the coffee for the stranger in the car behind her. What started as a single, random act of kindness became an 11-hour chain of generosity to strangers, each car paying for a coffee for the person in the car behind them. Even the baristas got into the action, pooling tips to help keep the giving going. Afterward, people said that this random act of kindness made their day a little brighter. (Firozi, 2014)
Types of gratitude
Data science is providing deeper insight into these kinds of social behaviors. While gratefulness has been shown to provide significant health benefits (Fox Glenn R., 2015), recent studies have found that the health benefits are greater when giving is unconditional. (Karns Christina M., 2017) There are two types of gratitude, called “passive” and “active”. Passive gratitude is defined as cherishing the things that you value in your life. Active gratitude is the feeling you get when a stranger does something nice for you without expecting anything in return, like the Starbucks coffee scenario. While both are beneficial for our health, there is a statistically significant, positive correlation between active gratitude and pro-sociality (r = 0.374), that is not present with passive gratitude. In other words, random acts of kindness trigger other random acts of kindness to other people, which is both good for us and good for society.
Many of these studies provide access to their data and so I decided to explore one of them using SAS Viya. (Ma, Tunney, & Ferguson, 2014) In this study, participants were asked to play a slow and tedious game. Half of the participants were randomly chosen to be players, and half were chosen to be helpers. Helpers could end the game sooner for the players, by either helping conditionally and expecting some form of repayment, or unconditionally by just helping to do a good deed. The game was tedious enough for everyone to want it to end.
Not surprisingly, the players that had helped to end the game sooner were more grateful than those that did not. However, researchers also found that players that received unconditional help perceived the helper’s motives as more helpful and experienced greater levels of gratitude. These feelings endured past the end of the game; people found they more willing to help others afterward.
Let's give this data to SAS
The data for this study is in SPSS format, which is easy to read into SAS using a simple PROC IMPORT. Below is an example of the code I used to import the data.
PROC IMPORT DATAFILE='c:\filename.sav' OUT=work.newfilename DBMS=SAV replace; RUN; |
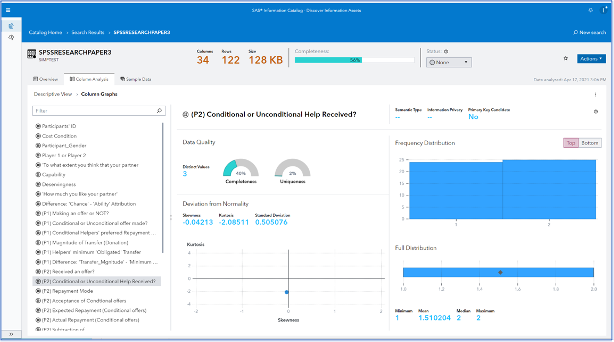
Using SAS Information Catalog, I first explored the data so I could understand the structure, important variables, and data quality. Figure 1 shows the distribution of one of the important variables, the participants that received some form of help. This shows that the distribution is approximately even across participants. You can also see that there are a few quality problems in the data which I might want to correct, for example, some of the variable names have unprintable characters in them.
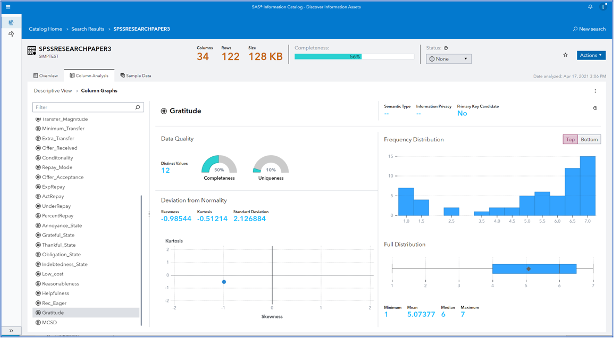
Another important variable is a measure of how grateful people were, shown in Figure 2 below. The graphs show how grateful people were when they received help, on a scale from 1 to 7. The data has a negative skew, which says that people were generally grateful for receiving any kind of help. This value is also the one that would be a good dependent variable for a predictive model.
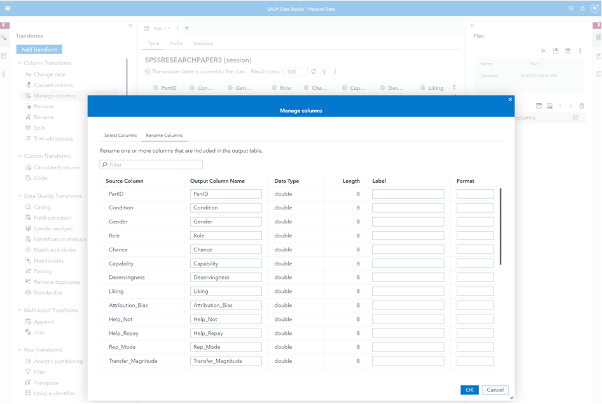
Since we detected a few odd characters in some of the labels in the Information Catalog, I cleaned these up using the manage columns node in SAS Data Studio. This is an easy-to-use data management interface for simple data wrangling.
The data was ready now for further exploration using SAS Visual Analytics.
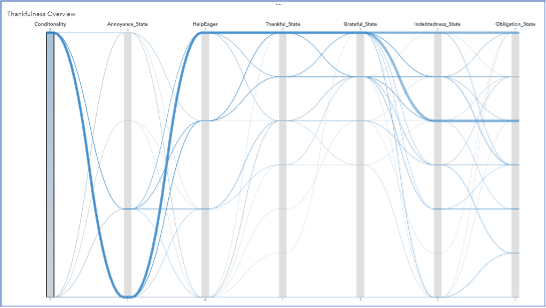
One useful analysis measure is to see how the different factors in the data correlate with each other. This is difficult to do when the variables are different types and scales. A parallel coordinates plot can compensate for these differences. Figure 4 shows a parallel coordinates chart, illustrating the relationship between some of the most significant variables.
This result is quite interesting. It clearly shows how conditional vs. unconditional help correlate in the data with many other factors. We can see that unconditional help caused people to be much less annoyed, more thankful and grateful, and feel less obligated and indebted to their benefactor.
Finally, it is interesting to explore the factors that can predict gratefulness. For this, I used the automated analysis features of SAS VA. Automated explanation shows the importance of various factors leading to higher levels of gratitude.
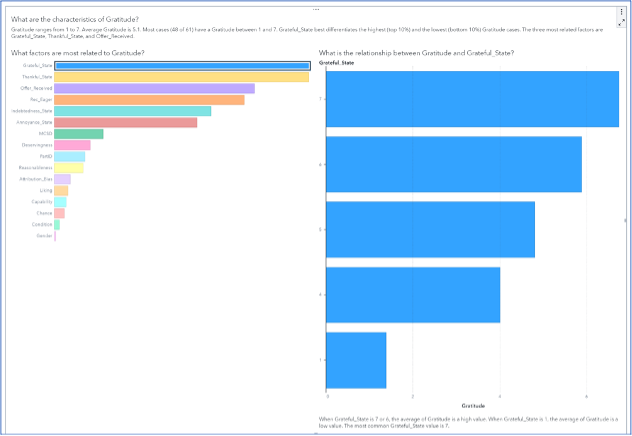
This analysis also shows that many variables are correlated with the target. A predictive model can tease out the most important factors that lead to different levels of gratefulness. I used the Automated prediction feature to perform this analysis. After removing most of the correlated features, the conditionality proved to be one of the most important features for predicting gratefulness.
Figure 6 shows gratitude level when help is given unconditionally.
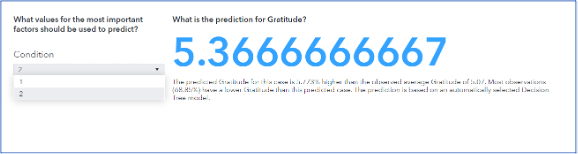
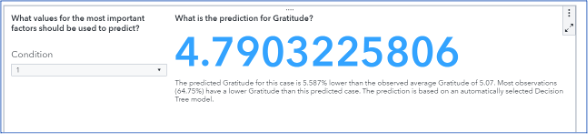
Figure 7 shows the decrease in gratitude level when help conditional.
A simple message
The North Carolina non-profit, Activate Good, has a sign that you can find in neighborhood yards and in public places in our area. It has a simple message:
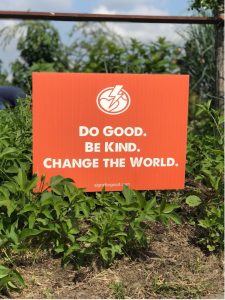
As the data from multiple studies have shown, this simple message is also conveying a simple truth. Random acts of kindness have a long-lasting impact on our own feelings of happiness and self-worth, and on our willingness to help others. Just like the people in the Starbucks line found, an act of random kindness makes us happy, and the world a little better.
References
- Activate Good. (2021, July). Activate Good. Retrieved from Activate Good: https://activategood.org/signs/
asenat29. (2021). asenat29. Retrieved from asenat29: https://www.flickr.com/photos/72153088@N08/6510934443 - Emmons, R. (2010, Nov 16). Why Gratitude is Good. Retrieved from Greater Good Magazine: https://greatergood.berkeley.edu/article/item/why_gratitude_is_good
- Firozi, P. (2014, Aug 21). 378 people 'pay it forward' at Starbucks. Retrieved from USA Today: https://www.usatoday.com/story/news/nation-now/2014/08/21/378-people-pay-it-forward-at-fla-starbucks/14380109/
- Fox Glenn R., K. J. (2015). Neural correlates of gratitude. Frontiers in Psychology, 6(1664-1078). doi:10.3389/fpsyg.2015.01491
- Karns Christina M., M. W. (2017, Dec 12). The Cultivation of Pure Altruism via Gratitude: A Functional MRI Study of Change with Gratitude Practice. Retrieved from frontiers in Human Neuroscience: https://www.frontiersin.org/articles/10.3389/fnhum.2017.00599/full
- Ma, L. K., Tunney, R. J., & Ferguson, E. (2014, Dec 8). Gratefully Received, Gratefully Repaid: The Role of Perceived Fairness in Cooperative Interactions. Retrieved from PLOS ONE: https://journals.plos.org/plosone/article?id=10.1371/journal.pone.0114976