
 A note from Udo Sglavo: The need for randomization in experimental design was introduced by the statistician R. A. Fisher in 1925, in his book Statistical Methods for Research Workers. You would assume that developing a successful treatment for COVID-19, the illness caused by the SARS-CoV-2 virus, will eventually conclude in a randomized controlled trial. However, it takes significant time and resources to conduct a clinical trial. Alternatively, the pharmaceutical industry and regulators have come to appreciate the value of assessing patient data “in the real world.” Let’s hear from Clay Thompson, Senior Research Statistician Developer in Scientific Computing R&D, about how to use causal modeling to obtain real-world evidence, and how this could lead to effective COVID-19 treatments.
Randomized controlled trials vs. real-world evidence
Of the many headlines about the SARS-CoV-2 virus and the COVID-19 pandemic, one that I have followed closely is the search for an effective treatment for those stricken by the illness. Even though research scientists around the world are working at an unprecedented pace to develop a vaccine, medical professionals are faced with the immediate need to treat patients.
The classical approach to developing a treatment culminates in a randomized controlled trial (RCT). Simply put, affected patients are randomly assigned to receive either a candidate treatment or a comparator treatment—for example, an existing standard of care or a placebo. The randomization step creates groups that are comparable or “exchangeable.” This means that the difference in outcomes (for example, recovery time or survival) between the two groups is causally attributable to the effect of the treatment.
There is a rich body of scientific literature (and programming tools such as Design of Experiments and the SEQDESIGN Procedure) for the design and analysis of trials. But in the case of COVID-19, all RCTs suffer from the same drawback: it takes significant time and resources to enroll patients and conduct a clinical trial. In the midst of a global pandemic, however, both are in short supply. Alternatively, there are more than 7,800 drugs approved by the FDA for use in humans. Surely one of these might be useful in treating COVID-19? Why not forgo the RCT altogether and use already-collected data from existing pharmacotherapies to accelerate the search for a treatment?
One of the major challenges of this strategy is that, without external randomization, it will almost certainly be the case that there are systematic differences between the individuals who do and those who do not receive a treatment. Also, some of these differences might causally influence the outcome of interest. For an analysis to be valid, considerable care is required in order to identify these confounding factors and make appropriate statistical adjustments. This is the process of formulating real-world evidence (RWE).
Although RWE is not new, it is gaining popularity as the pharmaceutical industry, and regulators have come to appreciate the value of assessing patient well-being “in the real world.” What is RWE? This post from Pharma R&D Today puts it nicely: RWE is real-world data (electronic health records, fitness trackers, insurance claims, and so on) together with analytics. Specifically, RWE is the process of taking observational data (that is, data that have been collected outside the context of a RCT, or data from a previous RCT that are being reanalyzed for a new purpose) and, through careful analysis, assessing the support for causal claims.
What does RWE look like? Let’s continue the example of the search for a COVID-19 treatment. Remdesivir has been approved for emergency use on the basis of nonrandomized clinical studies. Hydroxychloroquine had its emergency approval withdrawn, in part because of problems associated with an early observational study. Most unexpectedly, cigarettes enjoyed brief consideration as a possible preventive measure.
These examples illustrate two important points about RWE:
- RWE is inherently causal.
- RWE requires careful analysis and transparency.
Real-world evidence requires a causal model
In a recent blog post, my colleague Yiu-Fai Yung clearly summarized the differences between predictive modeling and causal modeling. In line with his arguments, a causal model is required if you want to use RWE in the search for a COVID-19 treatment. It is not enough to find that certain patient behaviors or characteristics are associated with improved outcomes. Rather, you need to know that an intervention (for example, administering a specific drug) will cause a desired outcome.
The association between cigarette smoking and COVID-19 is illustrative. As noted here, Smoking is marginally associated with an increased risk of death from COVID-19. But after adjustment for existing respiratory illness, smoking is associated with a decreased risk. Note that these are both associational measures. But with RWE, you want to know whether these associations can be interpreted causally. In other words, you need to decide whether the evidence supports the recommendation that someone should smoke cigarettes to prevent COVID-19.
Certainly you would not make this recommendation. To understand why, consider the following causal model. It is reasonable to assume that smoking increases your risk of respiratory illness, and respiratory illness independently increases your risk of death from COVID-19. These assumptions can be visualized as part of a causal graph. Here is a simple example:
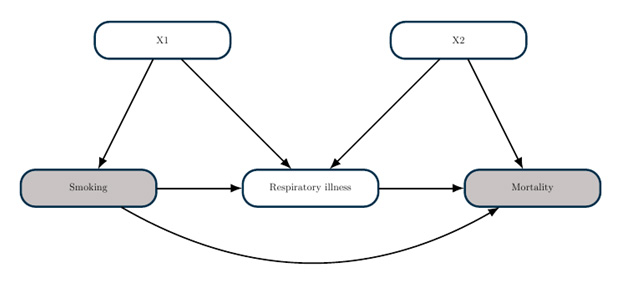
The goal of a causal graph analysis is to determine what statistical adjustments you need to make in order to estimate a causal effect. The theory of causal graphs, as implemented in the CAUSALGRAPH procedure, enables you to answer such questions within a rigorous framework. In this example, you could estimate the causal effect of smoking by comparing mortality between smokers and nonsmokers after adjusting for the covariates X1 (for example, demographic factors). However, you cannot estimate a causal effect by adjusting for respiratory illness, because this would lead to endogenous selection bias.
Real-world evidence requires careful analysis
A causal analysis will almost certainly involve statistical adjustments for confounding factors. But it is rarely obvious which variables you should include in the set of adjustments. As the smoking example (and the divergent fates of remdesivir and hydroxychloroquine) demonstrates, a poor adjustment decision (for example, because you naively adjust for all measured covariates) can lead to an erroneous outcome. Careful and transparent analysis is critically important for RWE.
There are two important steps that you can take to improve the quality and transparency of your analysis. First, use a “target trial” to form a well-defined research question. The target trial provides a useful bridge between the RCT that you would have conducted in an ideal world and the real-world data that you have. This framework can help to ensure that your data and analysis plan are sufficient to answer your research question.
Second, carefully articulate your causal assumptions about the system that you want to study, and represent this causal model in the form of a causal diagram. The theory of causal diagrams enables you to find a valid set of adjustments. Moreover, you do not need to know the theory yourself! Rather, you can analyze your causal model with PROC CAUSALGRAPH.
An additional advantage of a causal diagram is transparency. The causal diagram summarizes your assumptions about how the world works, and it is accessible even to those without advanced mathematical training. If someone doubts the results of your analysis, they can look at your causal model to see if they have any disagreement. After the causal model is agreed on, the necessary statistical adjustments are known (from PROC CAUSALGRAPH). No more arguing over which variables require adjustment!
It should be noted, of course, that creating a causal model is often the most challenging part of a causal analysis. It requires considerable care and careful consultation with subject matter experts. And the causal model does not tell you how to adjust for confounding factors. For that, you need powerful analytics tools.
Real-world evidence = real world data + analytics
The steps outlined in the previous sections provide useful guidelines for ensuring the validity of a causal analysis in support of RWE. Now that you have a clearly defined causal question, a data set suitable to answer that question, and a causal diagram that summarizes your modeling assumptions, the final step is the actual computation. And here’s the good news: if you have followed the previous steps, your causal analysis task is now a series of familiar predictive tasks! If you want to build a propensity score model, you can use PROC LOGISTIC or PROC HPSPLIT (among others), or you can use a tool specifically designed for causal inference (PROC PSMATCH). If you want to build an outcome regression model, you can use PROC GLM (among others) or the specialized PROC CAUSALTRT. You can even build both a propensity score model and an outcome regression model so that your results are “doubly robust.”
To summarize, to get RWE, you must carefully prepare and analyze real-world data by using causal and predictive analysis tools.
To learn more about causal analysis, see these resources:
- Causal Graph Analysis with the CAUSALGRAPH Procedure
- Causal Effect Estimands: Interpretation, Identification, and Computation
- Analysis of Observational Healthcare Data Using SAS
This is the third post in our series about statistics and analytics bringing peace of mind during the pandemic.


1 Comment
I like your example about the association between smoking and covid-19 death.