You are starting your data scientist journey and you are not yet familiar with SAS® Model Studio or SAS® software code. Nevertheless, you would like to build your own models to make some predictions. You know your data pretty well and you would like to identify which model gives the best results. SAS Visual Analytics will be your best friend!
If you are new to model development and to SAS Visual Analytics (VA), you might be afraid by the challenge of building models in the SAS Visual Analytics interactive interface. But don’t be scared, we will do it together step by step. You just need a SAS® Viya environment with SAS® Visual Statistics (VS) and/or SAS® Visual Data Mining and Machine Learning (VDMML) licensed. While SAS VS is required to compare the models, SAS VDMML’s license is optional. In the example, we will use tasks from both feature sets but you can still reproduce if you only have SAS VS.
Prepare the data
Throughout this blog, we will use the HMEQ table. This hmeq.csv file can be found on the SAS Support documentation site. The HMEQ table contains observations for 5,960 mortgage applicants. A variable named BAD indicates whether the customer has paid on the loan (BAD=0) or has defaulted on it (BAD=1).
- Open SAS Visual Analytics and load the file to the SAS® Cloud Analytics Services (CAS) server.
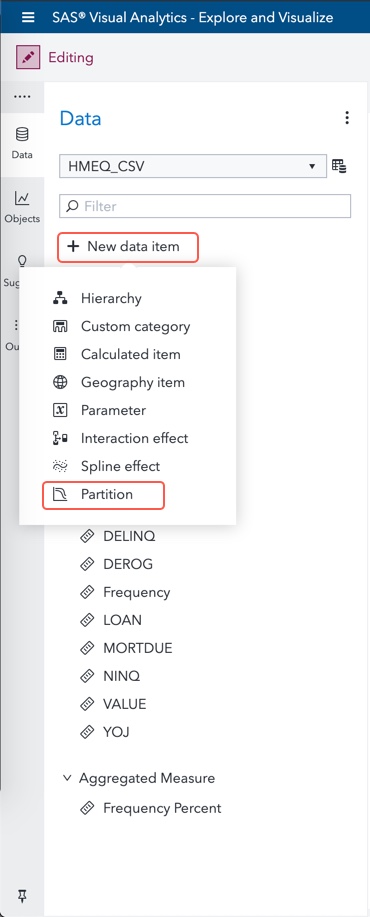
- We will first duplicate the BAD variable and convert it to a category. Right click on BAD variable in the Data pane and select Duplicate. When done, right click on the newly created measure and select Convert to category. You can then rename the category to BAD (CAT) to clearly differentiate the category and the measure data items.
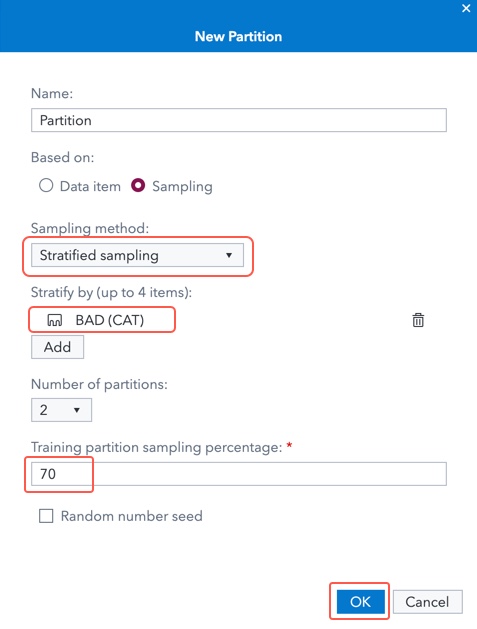
- We need to partition the data to get different sets of data to build and validate our models. For more detail on this step check out Beth’s post. To achieve this, click on New data item in the Data pane and select Partition.
In the New Partition window, specify the following options:
Create a logistic regression
The first model we will create is a logistic regression.
- Open the Object pane and add the Logistic Regression to your canvas.
- Next, assign roles for the logistic regression object. Click on the canvas and then open the Roles pane at the right-hand side. You should assign the variables to the different roles like this:
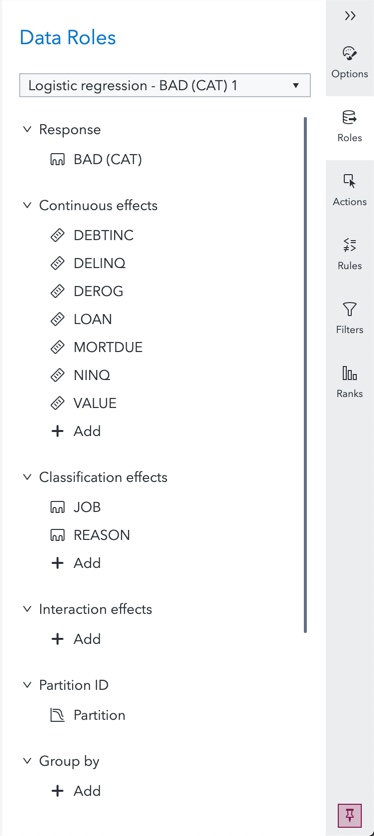
You have created your first model using SAS Visual Analytics! The canvas should look like this:

Create a decision tree
We could send this model directly to Model Studio, but since you have SAS VS and/or SAS VDMML, and let's assume you’re still exploring your data, it’s always a good idea to build additional models and then compare which better fits the data. But when developing a model, it is always better to compare different models in order to identify a "champion" model.
- Add a new page to your report.
- Add a decision tree object to your page.
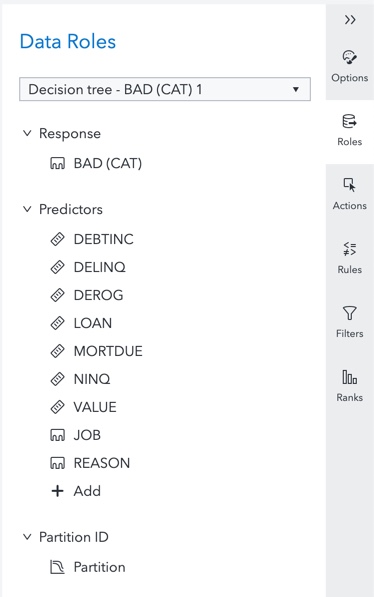
- Assign roles for the decision tree object. Click on the canvas and then open the Roles pane at the right-hand side. You should assign the variables to the roles like this:
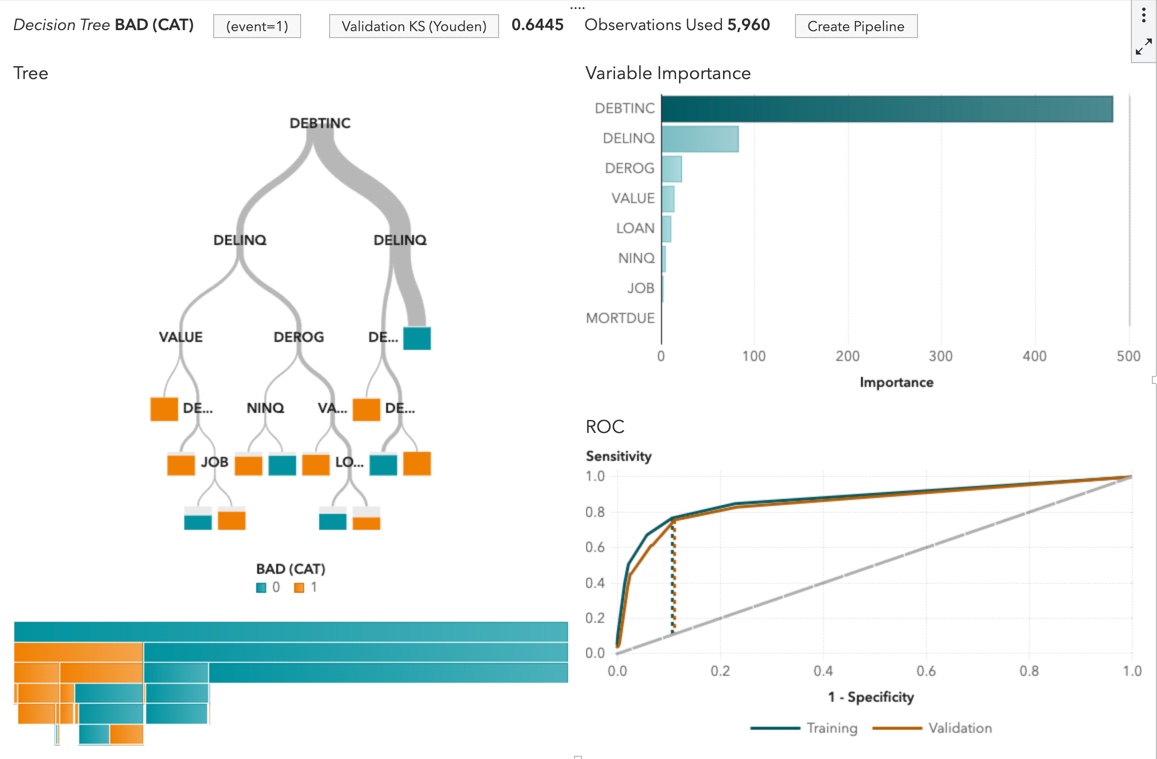
You have created a decision tree model and it should look like this:
Create a forest model
So far, we have created models that are available with SAS Visual Statistics license. The next two objects will be available with SAS Visual Data Mining and Machine Learning license.
- Add a new page to your report.
- Add a forest object to your page.
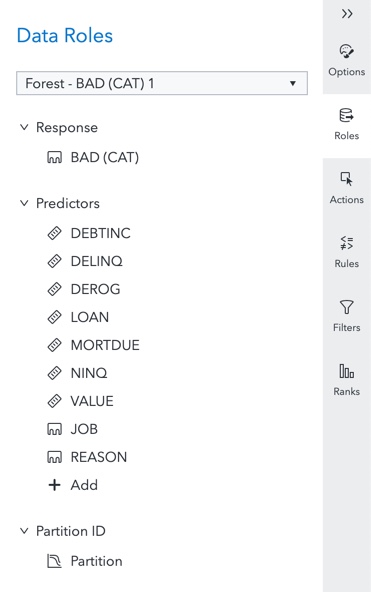
- Next step will be to assign roles for the Forest object. Click on the canvas and then open the Roles pane at the right-hand side. You should assign the variables to the roles like this:
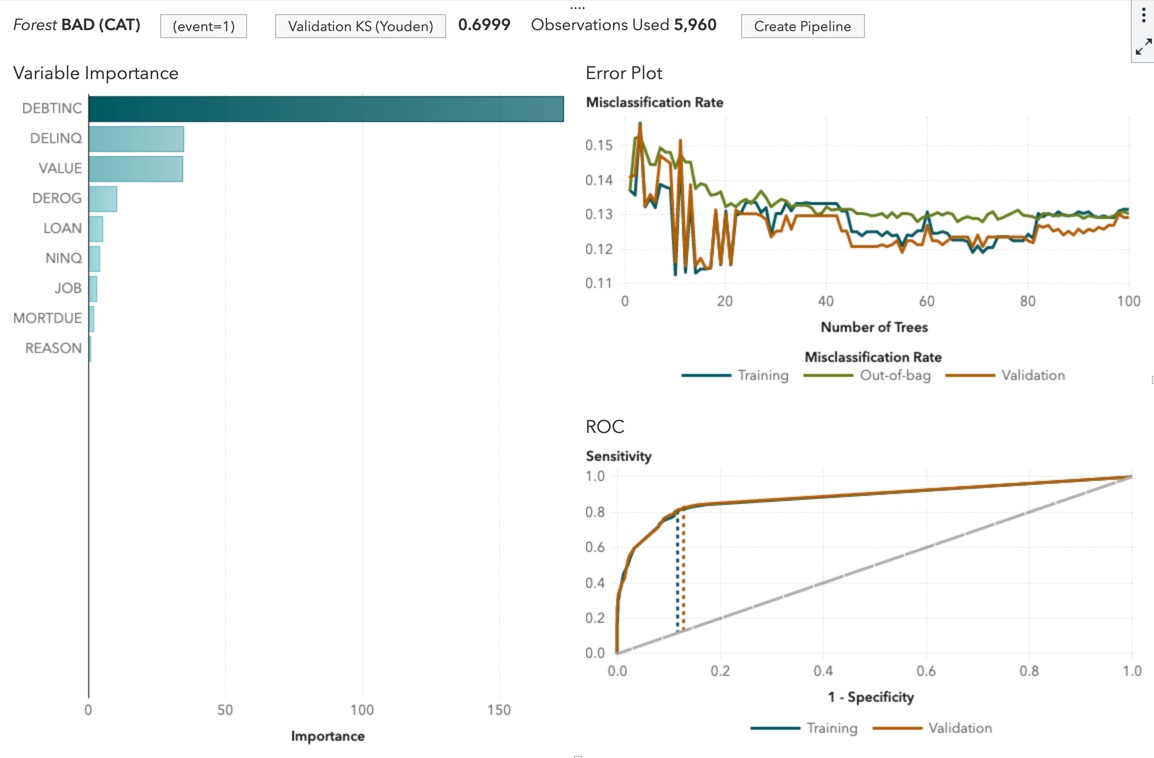
You have created a forest model and it should look like this:
Create a gradient boosting model
The next model we will create is a gradient boosting model.
- Add a new page to your report.
- Add a gradient boosting object to your page.
- Next step will be to assign roles for the gradient boosting object. Click on the canvas and then open the Roles pane at the right-hand side. You should assign the variables to the roles like this:
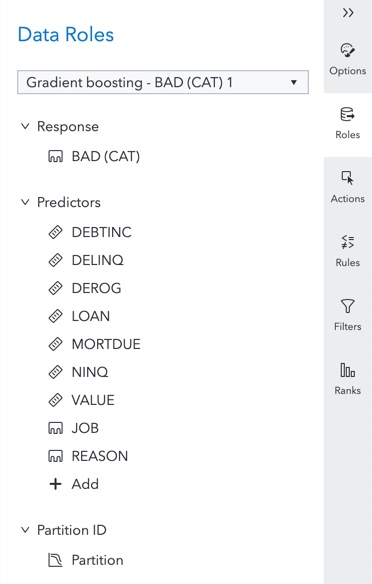
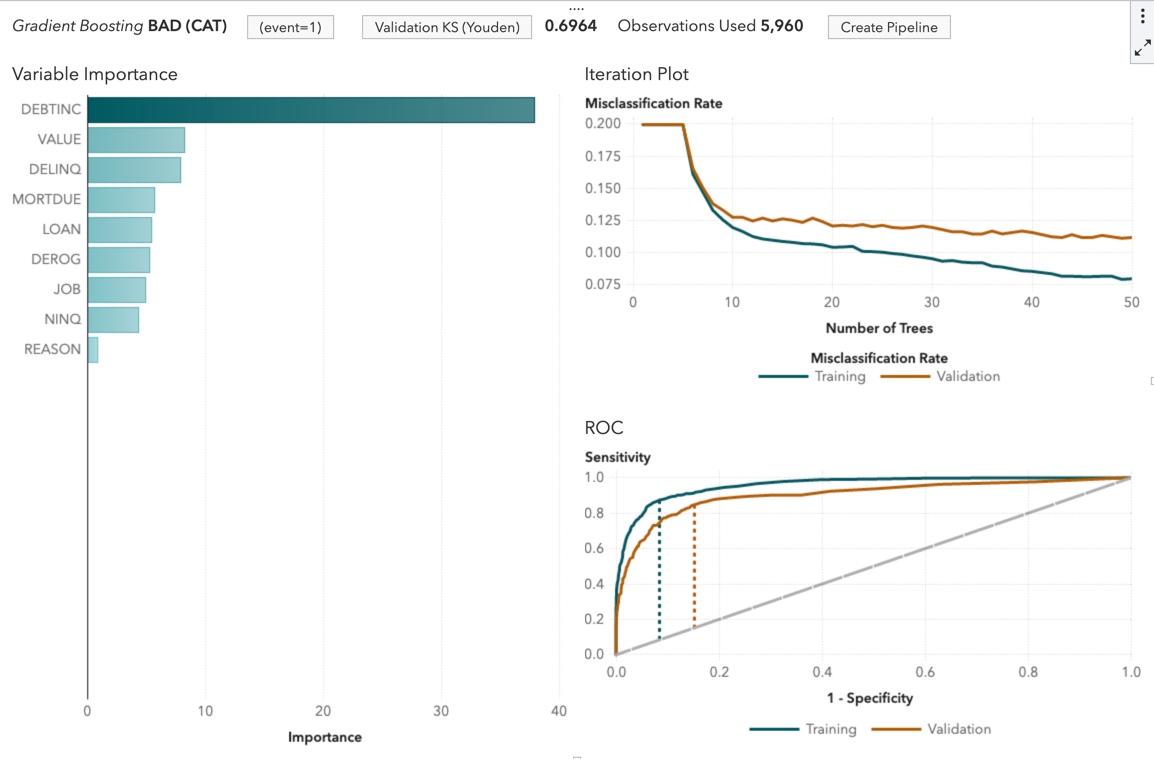
You have created a gradient boosting model and it should look like this:
Compare models
As you could see in the previous steps, creating models in the SAS Visual Analytics interface is not a difficult task, if you have SAS Visual Statistics and/or SAS Visual Data Mining and Machine Learning also licensed. Understanding which one the best to use might be a bit more complex especially if you are a beginner.
Of course, you could attempt to manually compare the different models or ask a more advanced data scientist to assist you to identify which model is the best. This is where the model comparison object is handy. SAS Visual Statistics comes with a specific object.
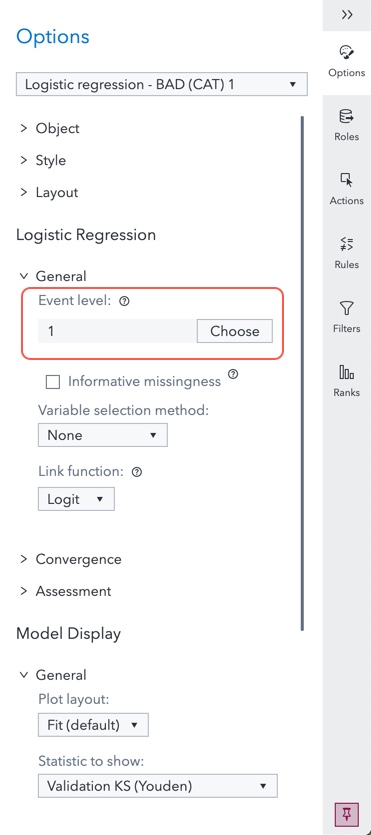
In order to compare all the models, we should adapt the logistic regression model. By the default, the object will use Event level with a value of 0 to calculate the ROC and Lift statistics. In order to compare with other models, we should set that value to 1. Open the page containing the logistic regression model, click on the canvas and open the Options pane.
- Add a new page to your report.
- Add a model comparison object to the page.
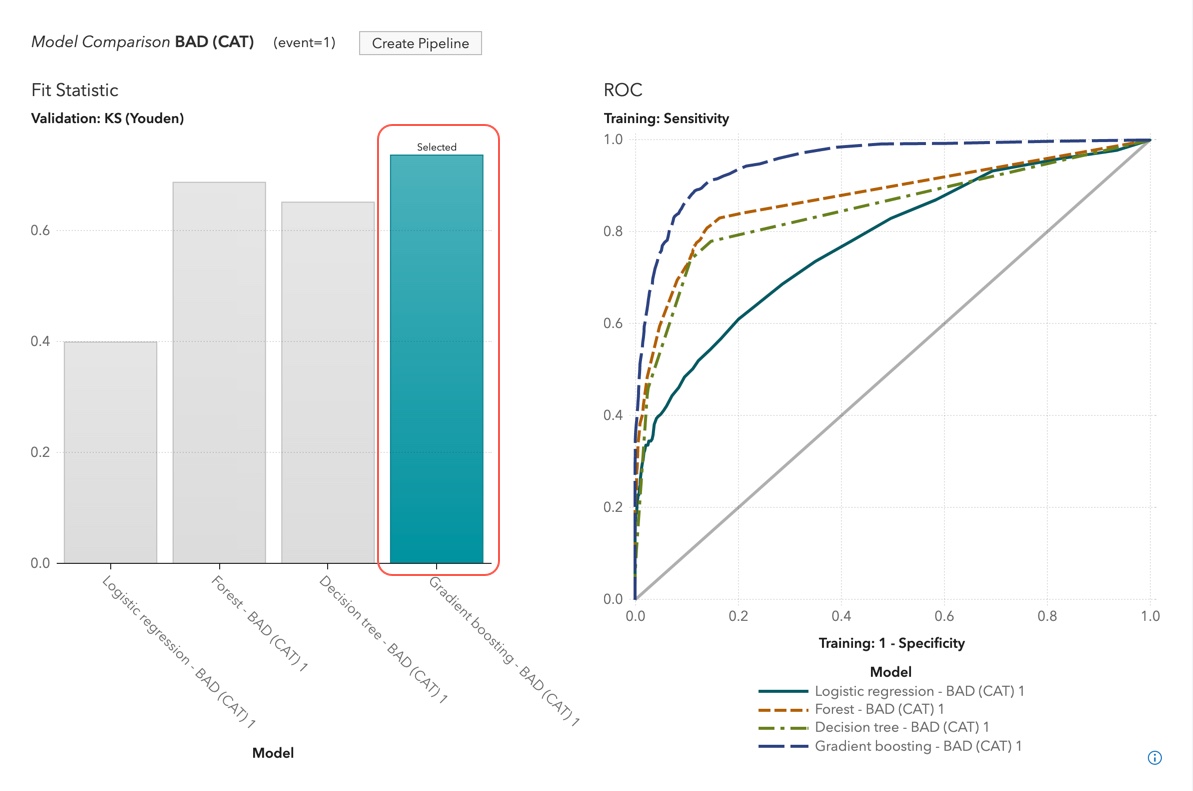
- In the Add Model Comparison window, check the Select all option and click on OK button.
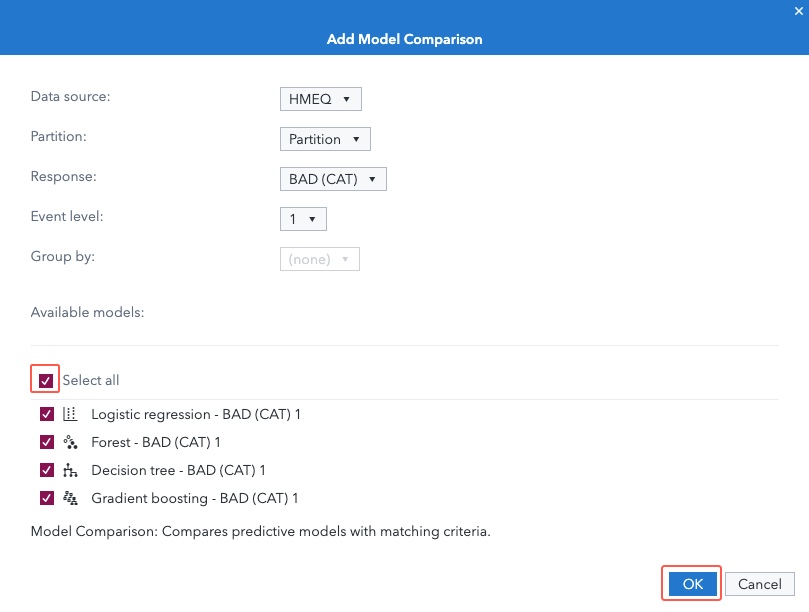
The model comparison will execute and the report object will show which model is the champion model. Notice that the selected model is the gradient boosting in this example:
What’s next?
We have now created models. Great!
We know which model is the best. Wonderful!
Now, what?
From SAS Visual Analytics, you can now create a pipeline in an existing SAS Model Studio project or in a new project. This is useful as you can share you results with colleagues and compare your model with the models your colleagues have created.
How can you do this? Just click on Create Pipeline button and select Add to new project.

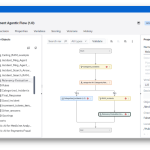
The platform will open SAS Model Studio for you and create a new pipeline with the champion model.
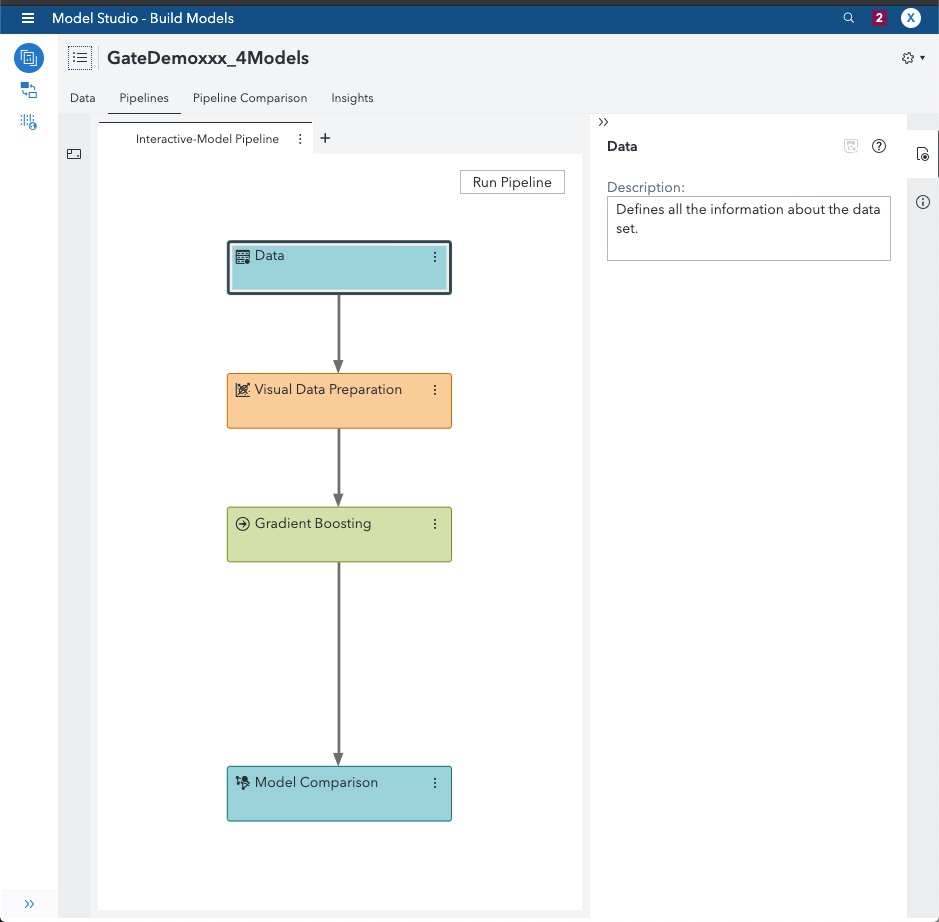
You can click on the Run Pipeline button to execute it. You can now open the Pipeline Comparison tab. It will show the results of the execution and most importantly you can decide to Publish your model.
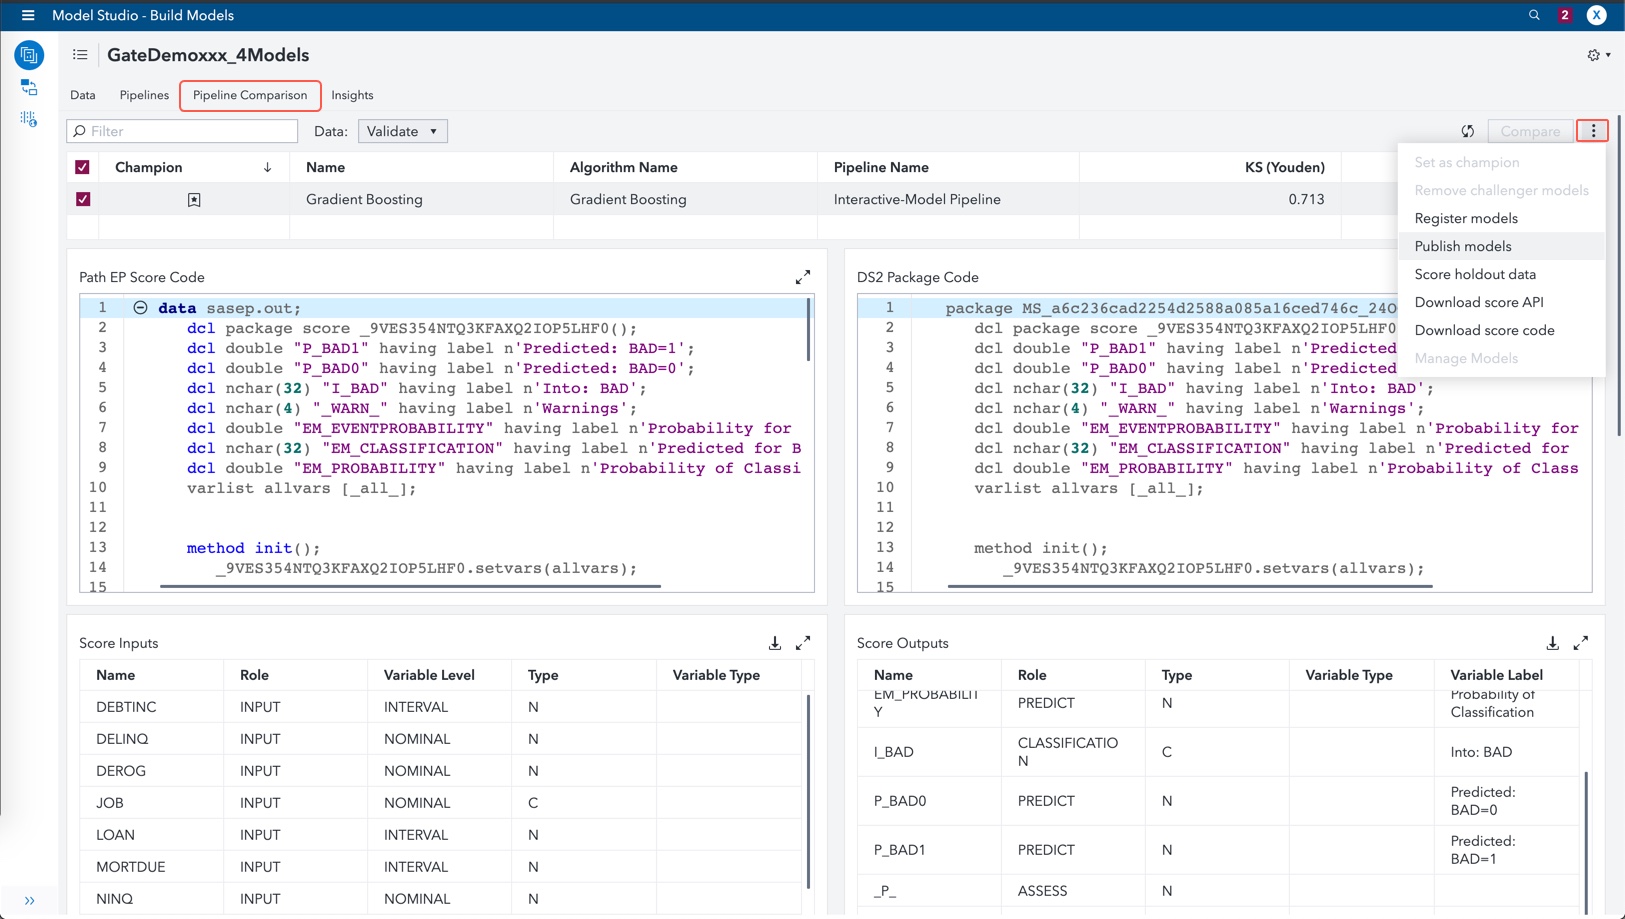
Why is it important to publish?
Models should be created to help make decisions. If you do not publish your models then they are not available for use in a decision workflow from our SAS® Intelligent Decisioning products. Go for the extra mile that changes models to decisions and ultimately to value!