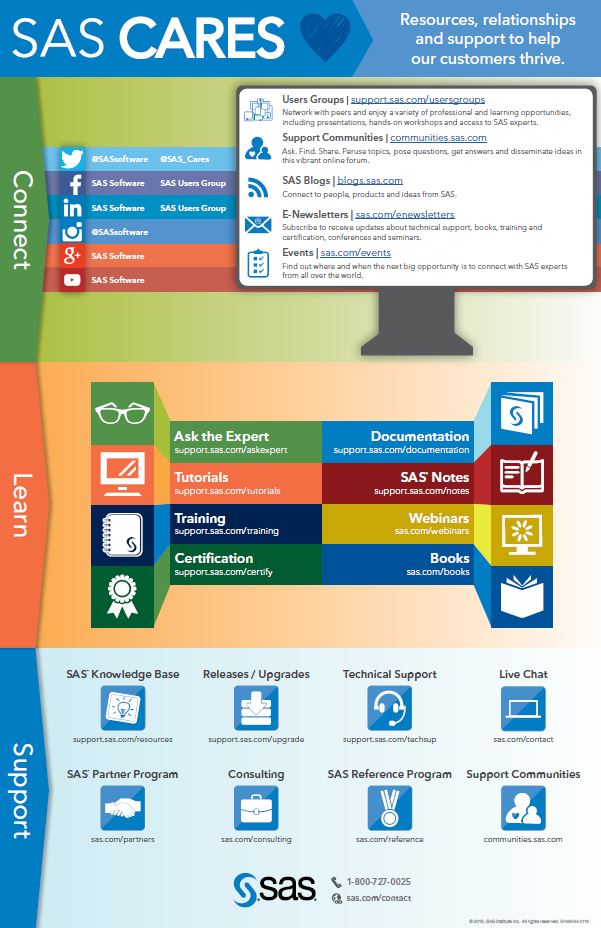
It’s no secret: here at SAS, we care about our customers. In fact, we care so much that we developed a program with that exact name: our SAS Cares program is here to help you with all things SAS! We know you may be so awesome that you never need
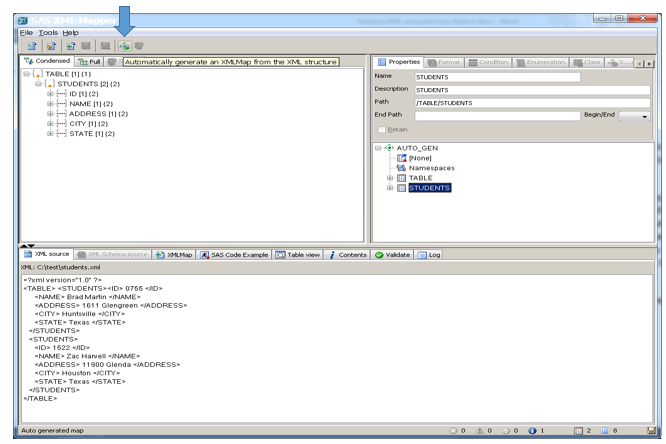
XML has become one of the major standards for moving data across the Internet. Some of XML’s strengths are the abilities to better describe data and to be more extensible than any of its predecessors such as CSV. Due to the increased popularity of XML for moving data, I provide
Report designers often discover after aggregating data by groups in the Visual Analytics Designer that it would also be nice to see additional aggregations of the data, for example, a maximum or minimum of that sum across groups. This means creating an ‘aggregation of an aggregation.’ If you plan your report objectives in
As an addendum to my previous two blogs on using the SAS Environment Manager Report Center, this blog illustrates further tips and tricks you can use to help make the creation of your custom reports easier. The Ad-Hoc Reporting section of the Report Center is specifically designed to provide a
"Shall we play a game?" If you’re a child of the ’80s like me, you might recognize this famous line from the movie WarGames. This innocent-sounding question comes not from one of the movie’s human stars, but from a military super-computer named Joshua, after a bored high school student, played
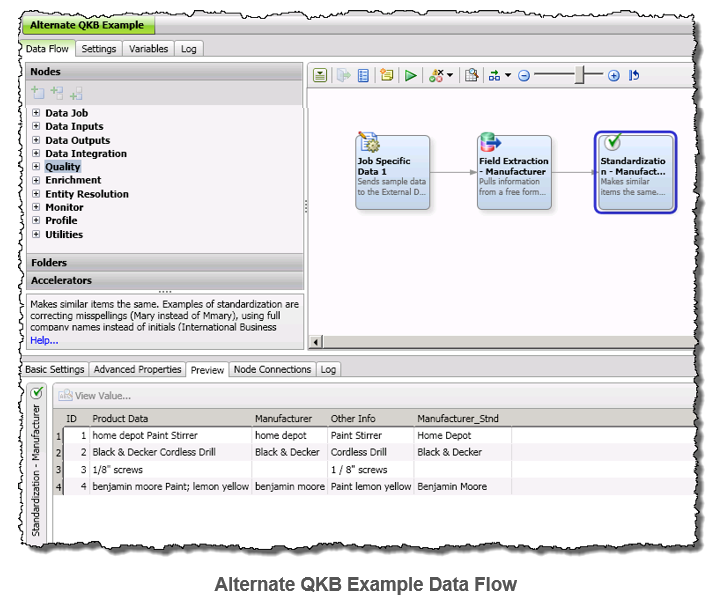
In DataFlux Data Management Studio, the data quality nodes (e.g., Parsing, Standardization, and Match Codes) in a data job use definitions from the SAS Quality Knowledge Base (QKB). These definitions are based on a locale (Language and Country combination). Sometimes you would like to work with multi-locale data within the
Nowadays, nearly every organization analyzes data to some degree, and most are working with “Big Data.” At SAS Global Forum 2016 in Las Vegas, a vast number of papers were presented to share new and interesting ways our customers are using data to IMAGINE. CREATE. INNOVATE., as this year’s conference tagline
Pick your category? If this title seems familiar, that’s because in my last blog, Use parameters to pick your metric in VA Reports, I covered how to use parameters to allow your users to pick which metric they want to view in their visualizations. This is a great technique that
Being a SAS consultant is about solving problems. In our day-to-day work we solve myriads of all sorts of problems – technical problems, data problems, programming problems, optimization problems – you name it. And in the grand scheme of things we solve business problems. But without a well-defined business
PROC FREQ is often the first choice when you want to generate basic frequency counts, but it is the last choice when it is compared to other statistical reporting procedures. People sometimes consider PROC FREQ last because they think they have little or no control over the appearance of the