After posting a couple of blogs on the subject of dates and date formats in Visual Analytics Designer, I got a question from a user who wondered how to compare data for a selected date to data from the same day of the previous year. Here’s one way to do
Author
Report designers often discover after aggregating data by groups in the Visual Analytics Designer that it would also be nice to see additional aggregations of the data, for example, a maximum or minimum of that sum across groups. This means creating an ‘aggregation of an aggregation.’ If you plan your report objectives in
In a previous blog, I discussed SAS date and time values, and how date and time formats can be used to your advantage in SAS Visual Analytics. That blog addressed some of the features provided for handling date information, like date formats, date hierarchies, and calculated data items based on time
You may have noticed that when using date information in SAS Visual Analytics, that the date data values can be displayed in a variety of ways. You may see your dates displayed like Jan1916, 03Jun1915, or 03/12/16, for example. In this blog I’ll help you understand SAS date and time
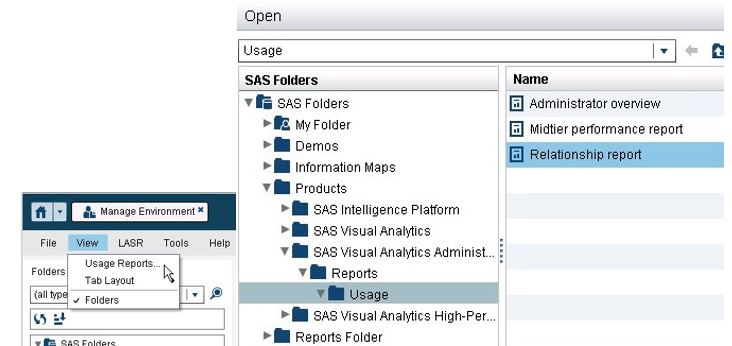
In SAS Visual Analytics 7.3, the usage reports accessed from the administrator includes a relationship report. This report provides very basic lineage and dependency information for selected object types. The data to populate this report comes from the middle-tier relationship service. Once you enable the collection and extraction of this
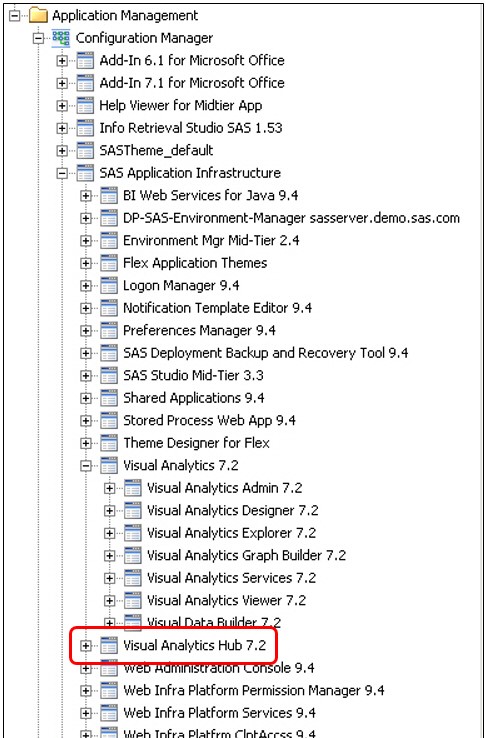
As of Visual Analytics 7.2, the home page is designed to serve as the entry point for not only Visual Analytics, but also additional SAS applications and solutions. To this end, the SAS Visual Analytics home page is documented in both the SAS Visual Analytics Administration Guide and the SAS Intelligence
New in the 7.3 release, SAS Visual Analytics now provides sample objects. During installation, the SAS Deployment Wizard prompts you to include sample reports by default. In addition to eight reports, an exploration and ten sample datasets are also included in the samples. These sample reports and datasets are available by industry
The new 7.3 release of SAS Visual Analytics not only uses the new HTML5 home page as the entry point to the Visual Analytics environment, but also introduces the new HTML5 viewer. The HTML5 home page interface features a personalized welcome message, tiles for content organization (Recent, Links, Favorites), icons to access