Welcome to the continuation of my series Getting Started with Python Integration to SAS Viya. In previous posts, I discussed how to connect to the CAS server, how to execute CAS actions, and how to filter CAS tables. Now it's time to focus on how to summarize columns.
Load and explore data
Let's first load some data. In SAS Viya we can use the Samples caslib for demonstration data. I'll load the data into the distributed CAS server using my CAS connection object conn, followed by the loadTable action. The loadTable action loads a server-side file into memory. Then I'll reference the CAS table in the tbl object and preview 5 rows using the SWAT head method. Remember, the data in this example is small for training purposes. Processing data in the CAS server's massively parallel processing environment is typically reserved for larger data.
conn.loadTable(path = 'WATER_CLUSTER.sashdat', caslib = 'samples', casOut = dict(caslib = 'casuser')) tbl = conn.CASTable('water_cluster', caslib='casuser') tbl.head() |
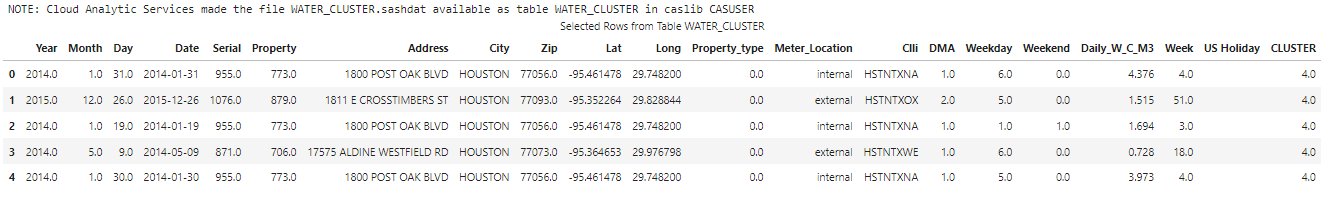
The water_cluster CAS table contains daily water usage for a variety properties. The Daily_W_C_M3 column displays the water used per location in cubic meters (m3) .
Simple summarizations
Next, let's execute methods for simple summarizations on CAS table columns. If you've used Pandas before these techniques will be very familiar.
I'll start by getting the total water consumption for all the data using the sum method in the SWAT package on the CAS table column Daily_W_C_M3.
(tbl .Daily_W_C_M3 .sum() ) # and the results 401407.88800000015 |
Next, I'll view the maximum and minimum water consumption value in the data using the max and min methods in the SWAT package.
(tbl .Daily_W_C_M3 .max() ) # and the results 11910.0 (tbl .Daily_W_C_M3 .min() ) # and the results 0.0 |
Lastly, I'll find the average water consumption value in the CAS table using the mean method.
(tbl .Daily_W_C_M3 .mean() ) # and the results 8.591778424657537 |
Instead of manually specifying each method to view summary information, I could of used the summary CAS action or the describe method from the SWAT package. For more information check out my previous post Descriptive Statistics.
Find the property with the max water consumption
What if I want to find the property or properties with the max water consumption? One technique is to find the max water consumption value, then filter the CAS table for the row (or rows) with that value. Here I will store the max water consumption value in the variable maxWaterConsumption. Then I'll use the variable in the query method to filter the CAS table. For more information on filtering CAS tables, check out my previous blog post Filtering CAS Tables.
## Store the max water consumption value maxWaterConsumption = (tbl .Daily_W_C_M3 .max() ) ## Filter the CAS table for the property with the max water usage (tbl .query(f"Daily_W_C_M3 = {maxWaterConsumption }") .head() ) |
 The results show that the property address 1660 S DAIRY ASHFORD ST had the largest daily water consumption rate.
Find the top 10 daily water consumption values and properties
Lastly, to find the top 10 daily water consumption properties and values I can use the nlargest method in the SWAT package. This method is similar to the Pandas nlargest method. One difference is the SWAT nlargest method does not implement the keep parameter.
I'll specify the SWAT nlargest method and store the results in the variable df_top10. Then I'll display the results.
df_top10 = tbl.nlargest(10, 'Daily_W_C_M3') display(df_top10) |
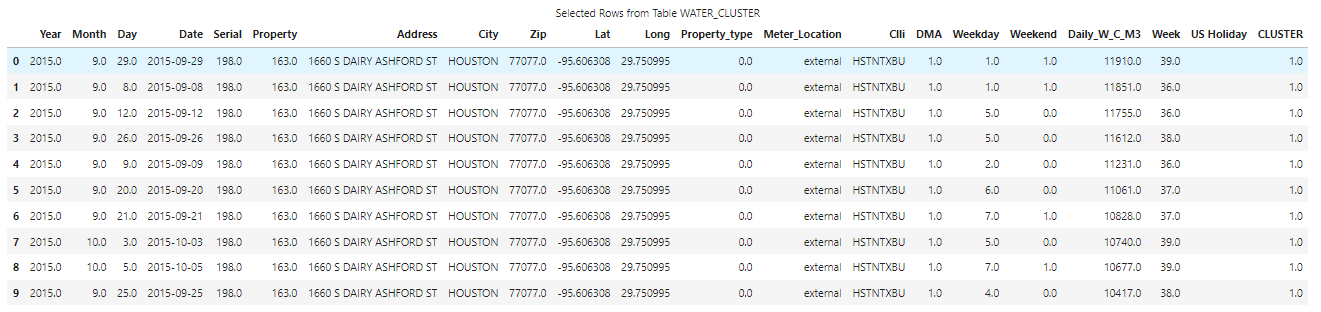 The CAS server will execute the request and return a SASDataFrame to the client. The SASDataFrame shows that a single property contains the top 10 largest water consumption values.
Remember, a SASDataFrame is a subclass of a Pandas DataFrame. As a result, you can work with them as you normally would a Pandas DataFrame. To learn more about working with CAS objects check out my previous post Working with CAS Actions and CASResults Objects.
Summary
The SWAT package blends the world of Pandas and SAS, making available many familiar Pandas techniques to work with your distributed CAS tables. This enables you to utilize the massively parallel processing power of the CAS server in SAS Viya using Python. Here we learned about using familiar Pandas methods in the SWAT package like sum, min, mean, max and nlargest.