Managing multiple programming languages in a data science workflow often means jumping from one environment to another—adding friction to already complex processes. This slows down collaboration and innovation among teams. But what if there were a way to remove this friction between environments? Working in a single environment that supports multiple coding languages helps give teams time back for development, rather than managing tools. For example, being able to run Python, R, and SAS together in one environment eliminates the need to switch between two or three different platforms and allows experts to work in the language they’re most comfortable with.
In Life Sciences and Healthcare, working across different tools often means switching platforms or duplicating work. In this article, we explore how combining multiple programming languages within the same workflow can help reduce that friction—using SAS for data cleaning and exploration, and R for modeling and app development.
Step 1: Clean and explore data
The first thing you want to do is load your data. For this case, I’m using a dataset about classifying heart disease. This dataset includes 14 variables selected by researchers to describe each patient and their current health. The original researchers had over 76 features and chose 13 to build linear regressions and feed into an algorithm based on Bayes Theorem. The study is available online if you're interested in reading more about it.
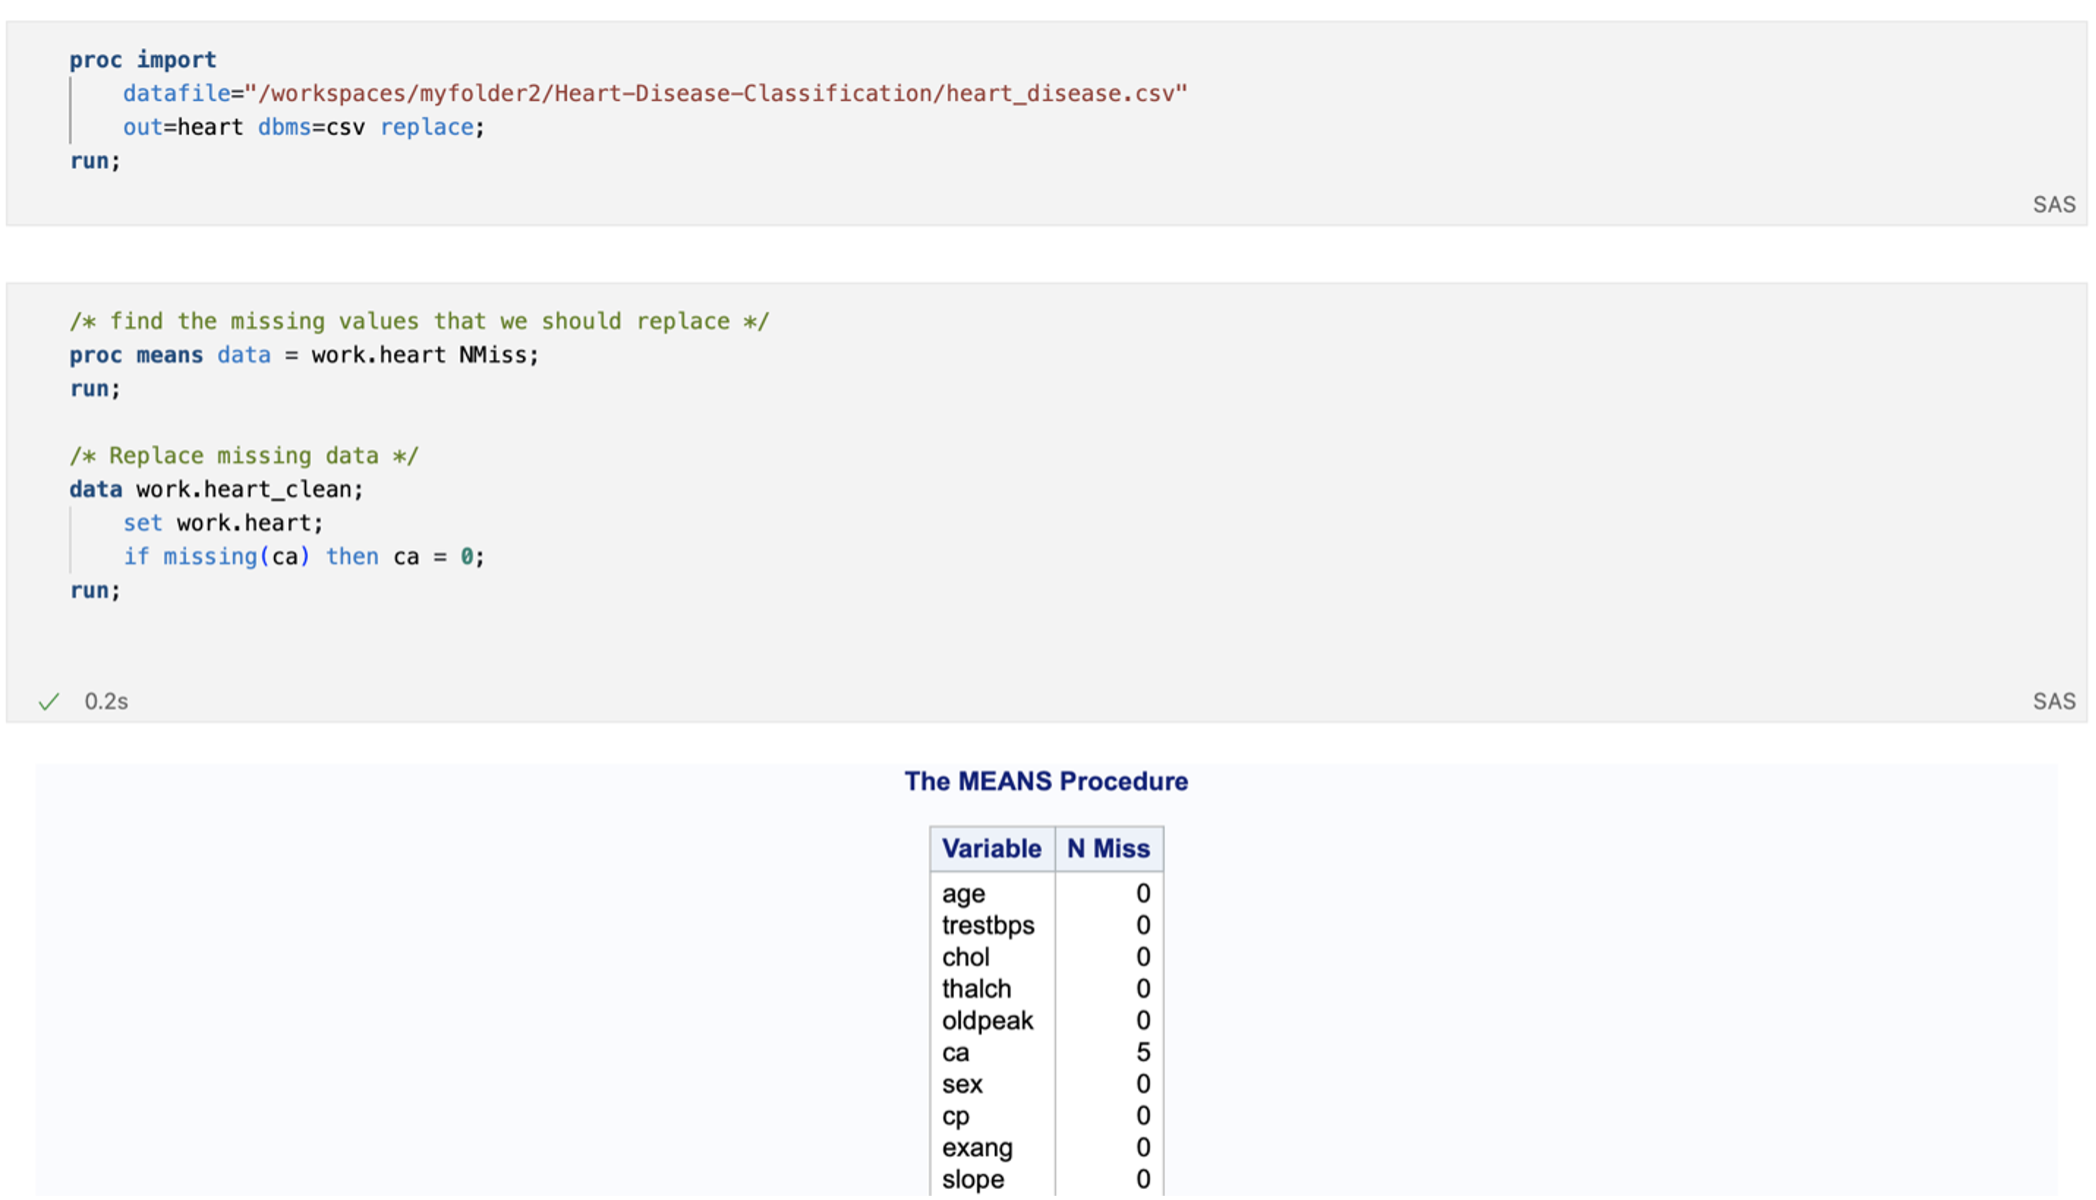
In a SAS Notebook, I first import the data before jumping into data cleaning by checking for missing values and replacing them with a relevant value. In this case, we see that only ca has missing values—this variable represents the number of major vessels visible during fluoroscopy. It ranges from 0 to 3, and if values are missing, we assume the test wasn’t performed on that patient, so we assign it a value of 0.
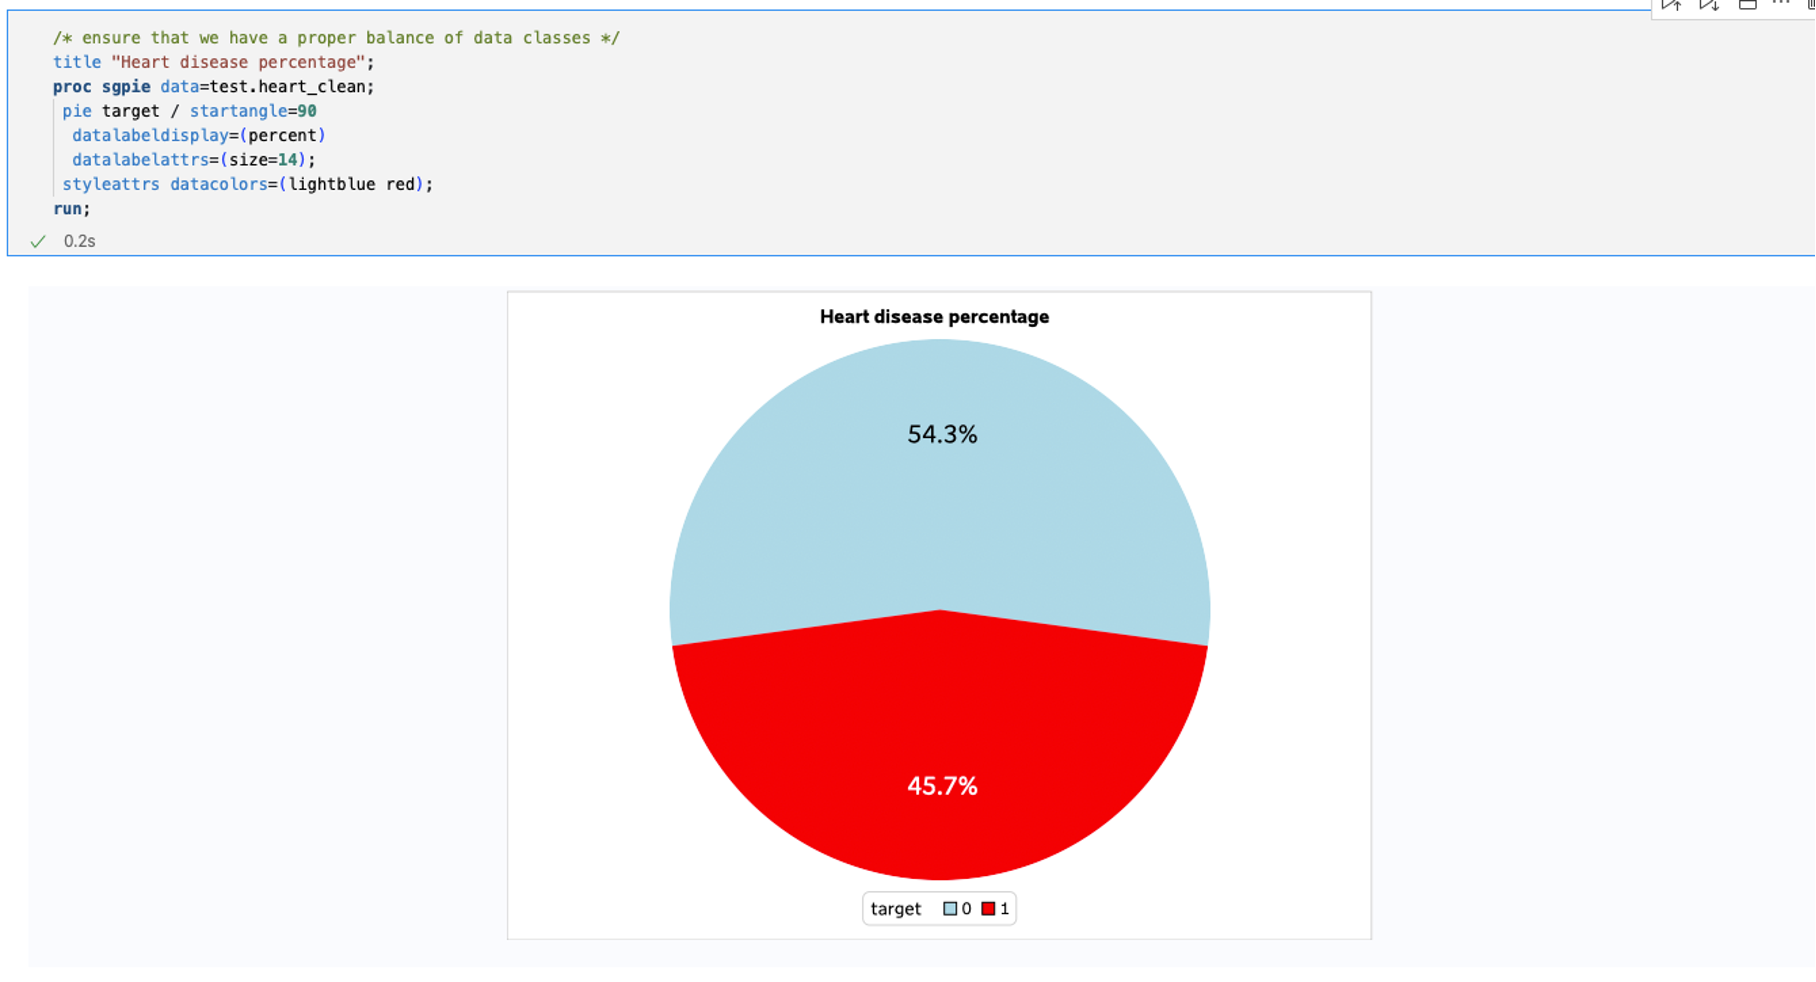
Next, I checked to make sure that there is an even distribution of data between our two classes by plotting our target variable with a pie chart. Neither class has an overwhelming presence in the dataset, which means there is no need to balance the dataset. This means that our quick data cleaning and exploration is done and that we can move over into our modeling in R.
Step 2: Transfer data into R and train gradient boosting model
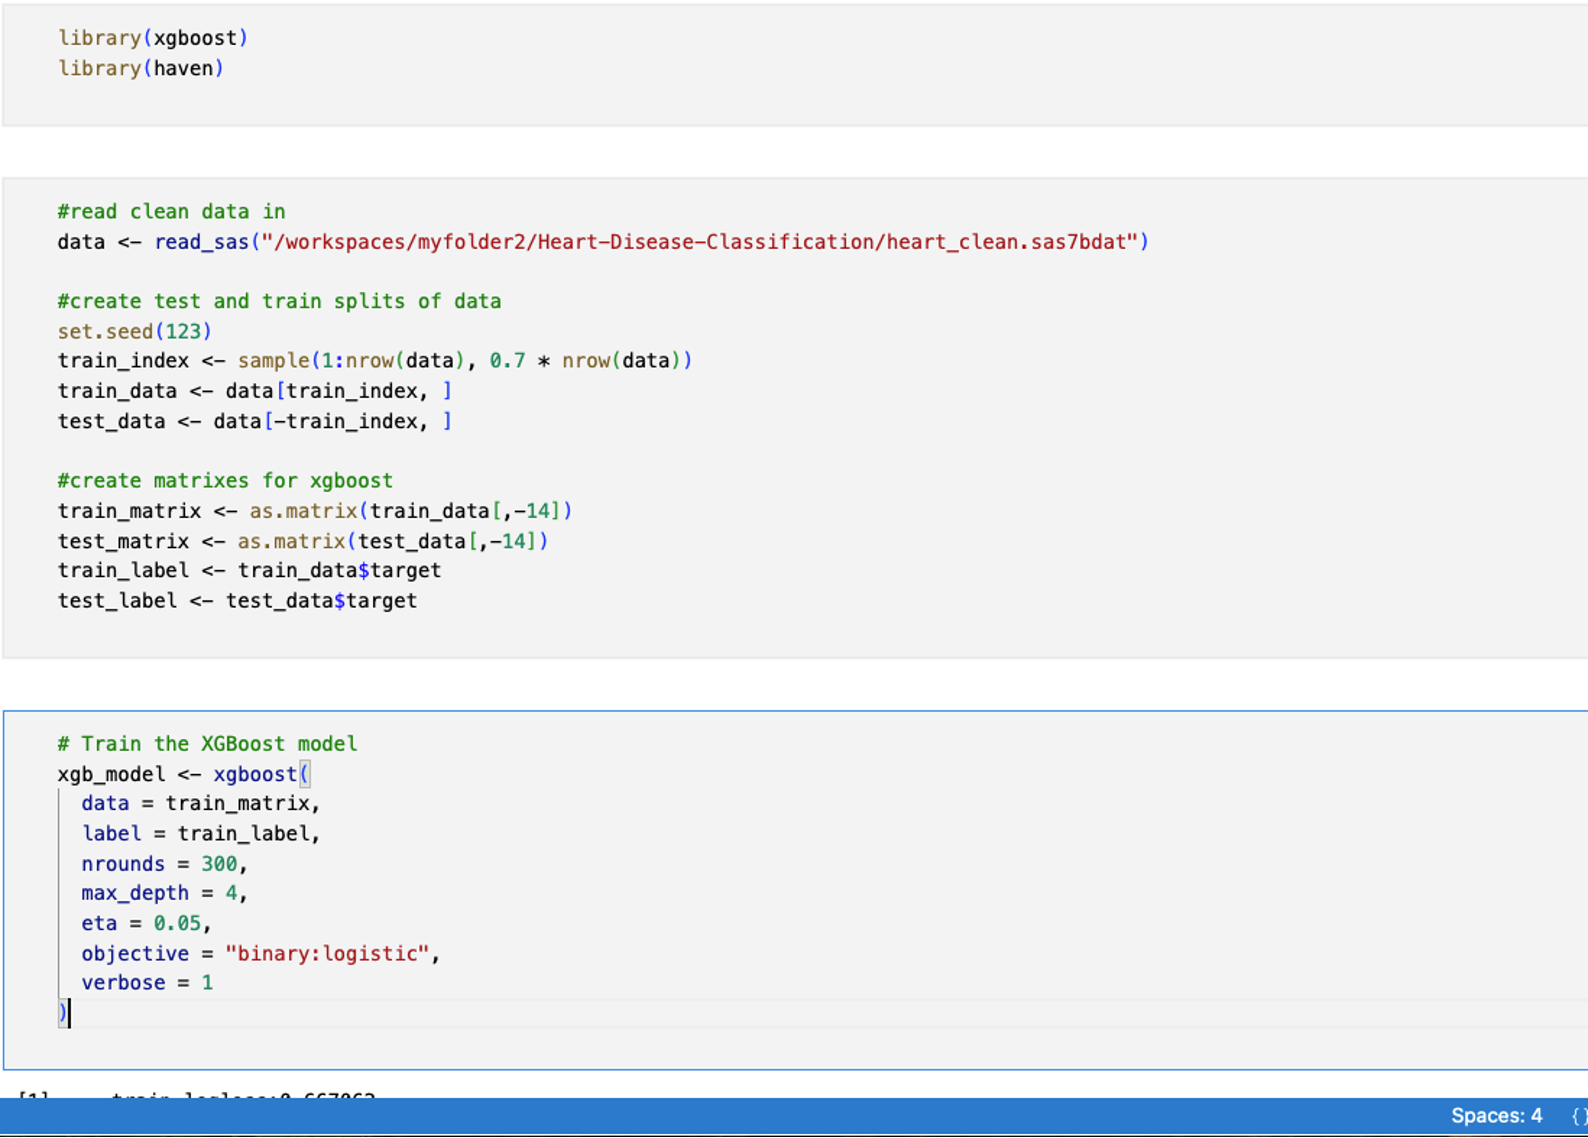
This step can be done in a couple of different ways. The first is a bit more roundabout—exporting the .sas7bdat files to a CSV and then reading that CSV into an R notebook. The second option is to download the haven library in R and use the read_sas() function to bring the data directly into R. I went with the second option before creating training and test datasets to train a gradient boosting model using the xgboost library.
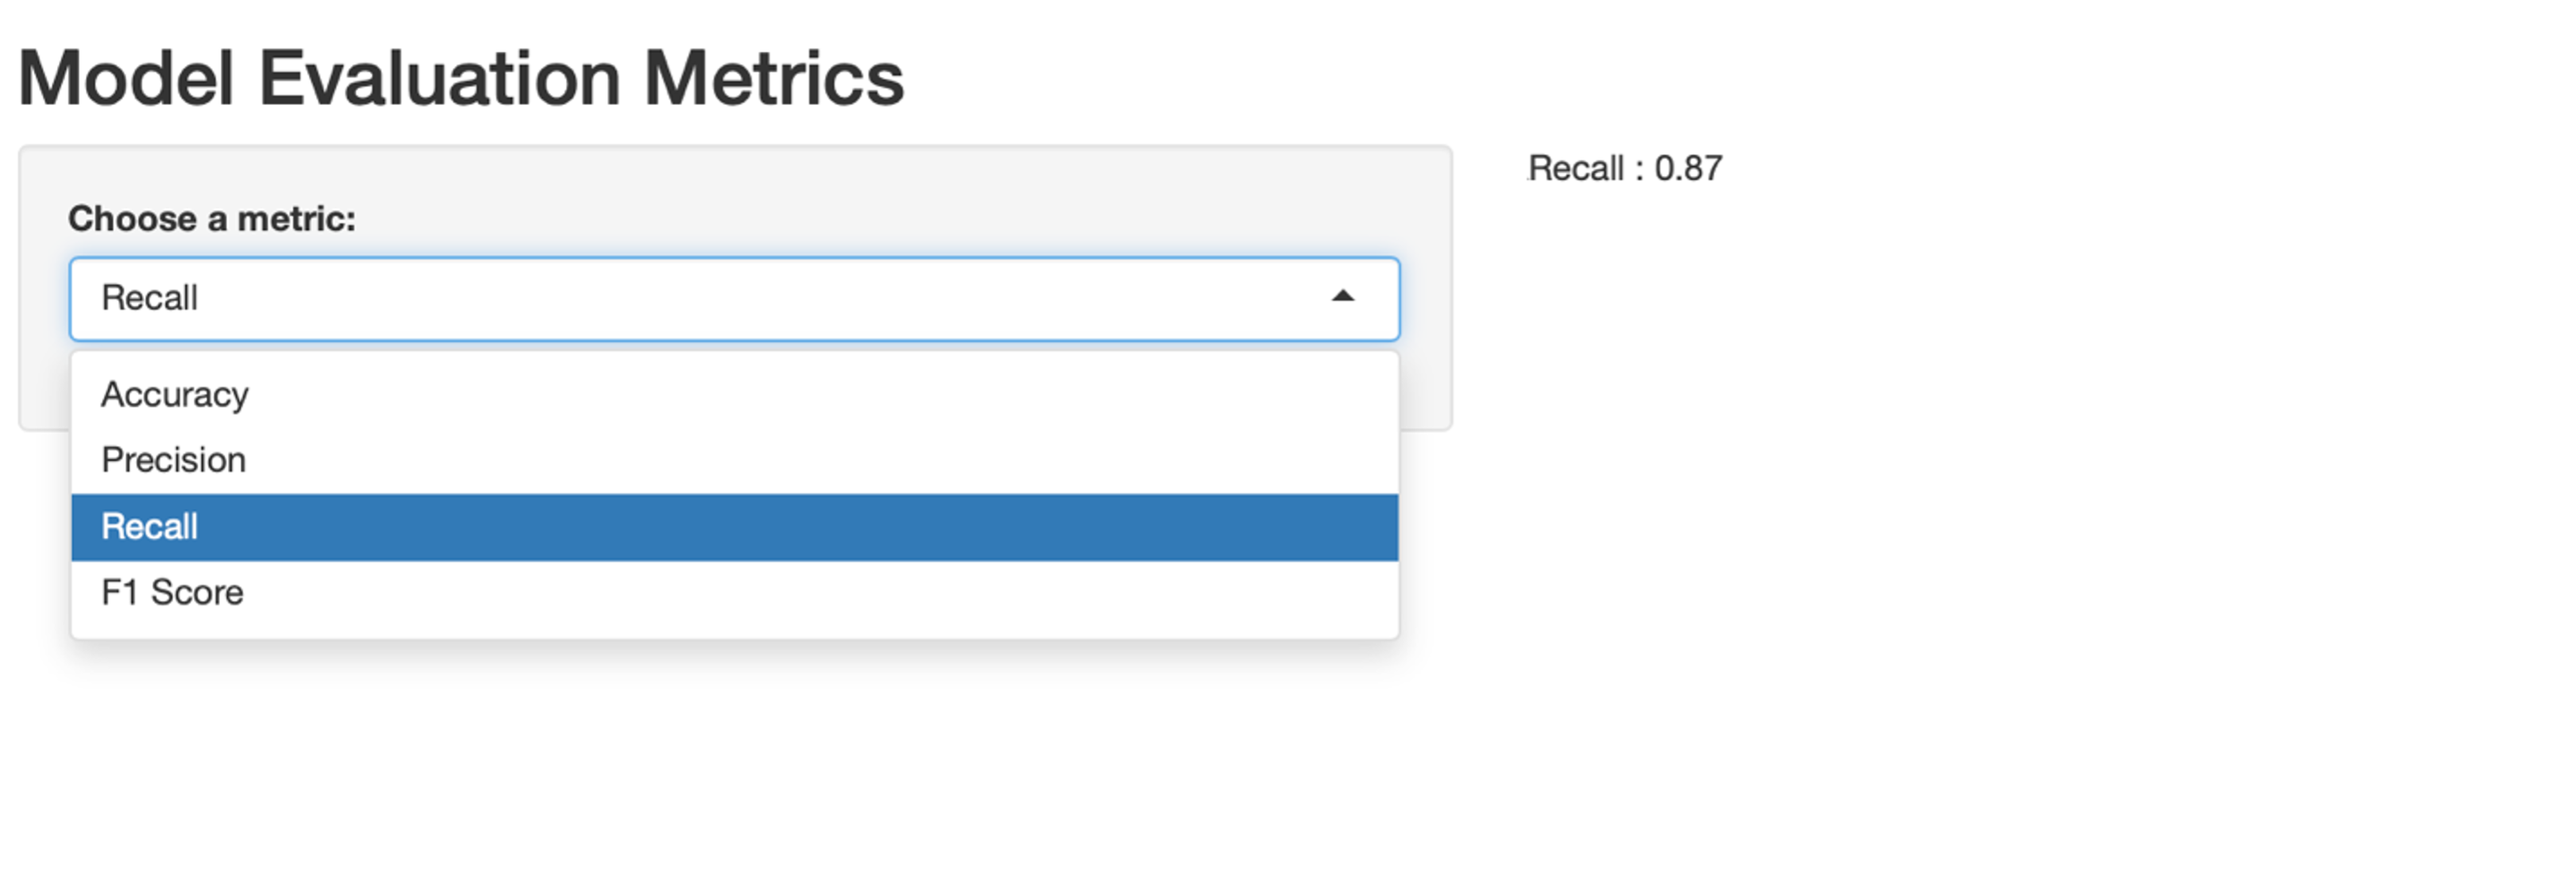
Step 3: Display model performance with Shiny app
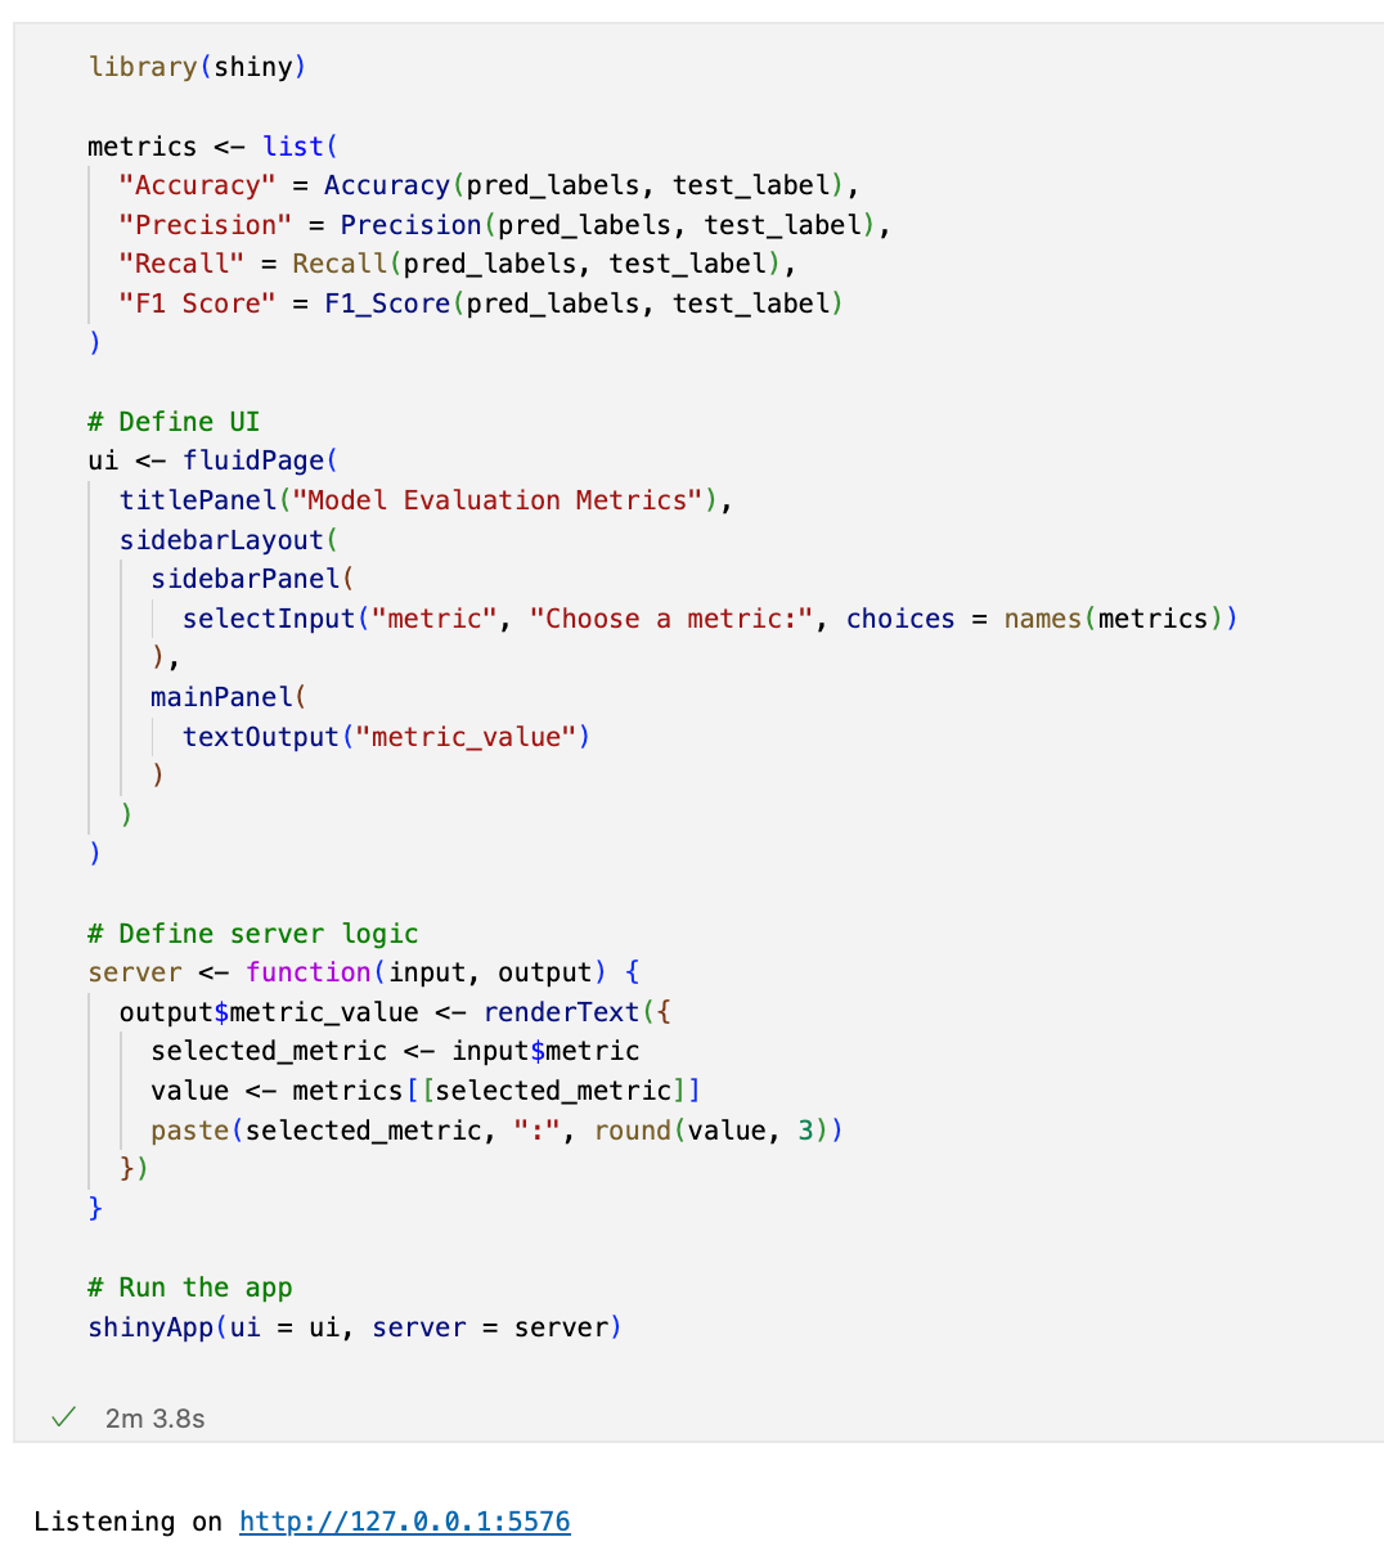
We can now evaluate how well our model performed by gathering metrics like Accuracy, Recall, Precision, and F1 Score. Once these are calculated, we can create a simple Shiny app that allows users to choose which metric they want to view. This app can be as complex as you'd like—with interactive charts—or as simple as a drop-down menu.
Conclusion
Bringing together the strengths of SAS and R creates a powerful, end-to-end data science workflow. SAS excels at data cleaning, transformation, and preparation—especially when working with large, structured datasets in enterprise environments. Once the data is clean and ready, R adds value as a powerful tool for building machine learning models using packages like xgboost. By integrating a Shiny app into the workflow, results become easily accessible and interactive. This seamless pipeline empowers teams to make data-driven decisions with clarity and confidence.
All this to say, there are three main takeaways from using a multi-language environment:
- Choosing the best tool for the job: Each coding language can be used to excel in different areas of the pipeline.
- Collaborate across unique skill sets: Developers from different language backgrounds can bring their expertise to build dynamic teams. Each team can communicate seamlessly between components.
- Adapt to evolving tech trends: Each language brings new innovations, and by including multiple languages together, we can stay competitive and future-ready.
Ultimately, a multi-language environment empowers developers to collaborate on scalable solutions faster and smarter.

2 Comments
How can the connection be seamless, without an R package like have, but with write_sas? Does SAS provide a R package to convert a R dataframe to a SAS dataset, like stat transfer. I don'r see how the interface can be seamless without the ability to create a SAS dataset. SAS could work with R developer, Even Miller, to create the package.
We are working on a few other ways for SAS to connect to R in the future. There is a bit of effort using csv files or open source packages to transfer data between R and SAS, but the seamlessness I was referring to comes from not having to switch back and forth between environments.