I am a die-hard Survivor fan. I was born the year after the show came out, and since then I have tuned in for every single episode, with season 48 being no exception. However, I’ve noticed a trend: the players I think are most deserving of the million dollars never end up winning! As a data lover, I was curious about what the stats said. What qualities make a Survivor winner? Did the players with the best stats end up winning the game? And, most importantly, can a model predict who will win future seasons?
To do my analysis, I found an incredible database compiled by Jeff Pittman, a fellow Survivor superfan and data nerd. He has compiled stats on challenge wins, voting records, and immunity idols for all the 47 completed seasons. For my analysis, I’m going to use SAS Viya Workbench, a cloud-based coding environment that allows me to access SAS analytics while coding in Python.
Winner Stats Overview
I was interested in exploring the traits of the Sole Survivors. I selected the winners and identified notable players in terms of challenge wins and voting record. Note: if you are not caught up on seasons 1 through 47, read at your own risk! Spoilers abound.
Challenge Stats
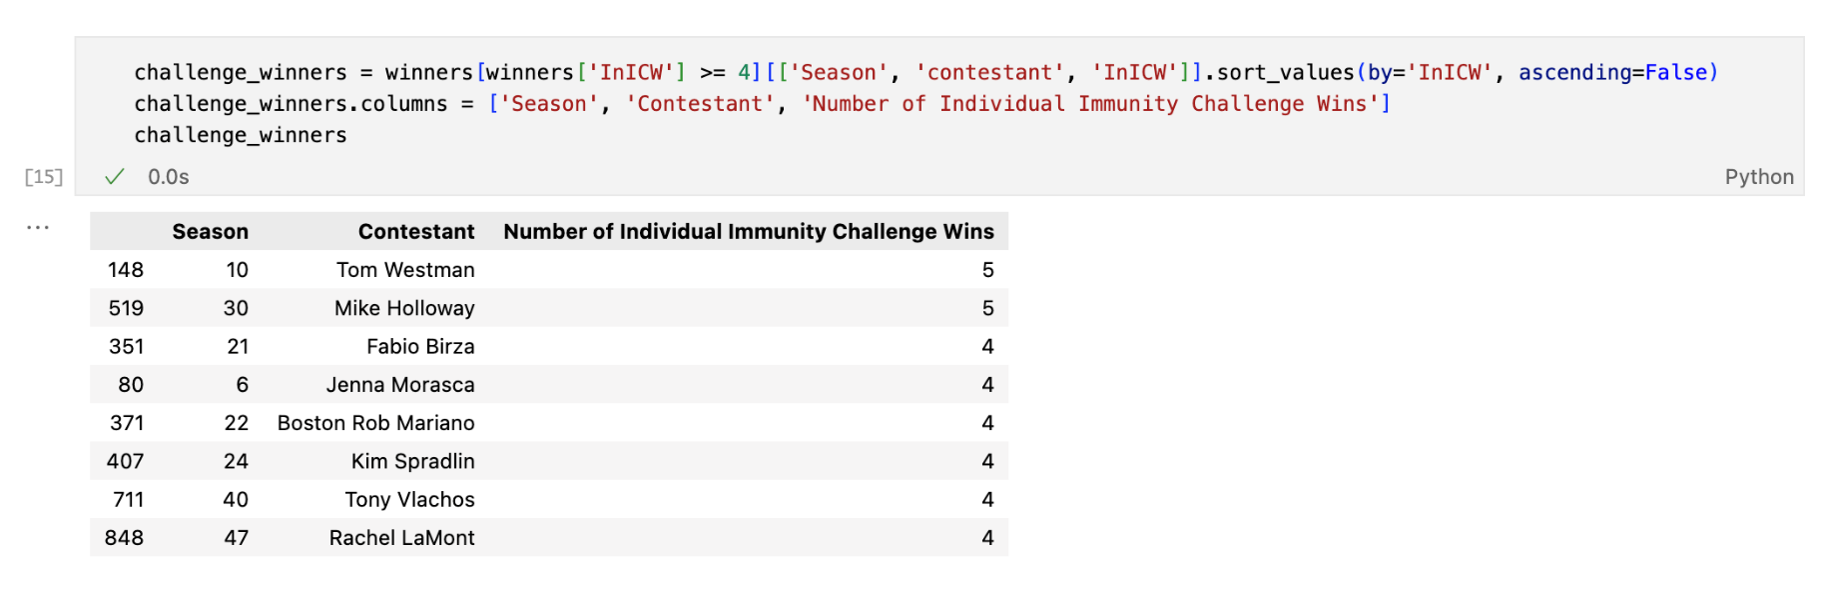
First, I looked at individual immunity challenges, which are physical challenges players compete in individually that allow them to be exempt from being voted out if they win. Of those who went on to win the game, which of the players had the most individual immunity challenge wins? Below is a list of all the winners with four or, in the case of Tom and Mike, FIVE wins!
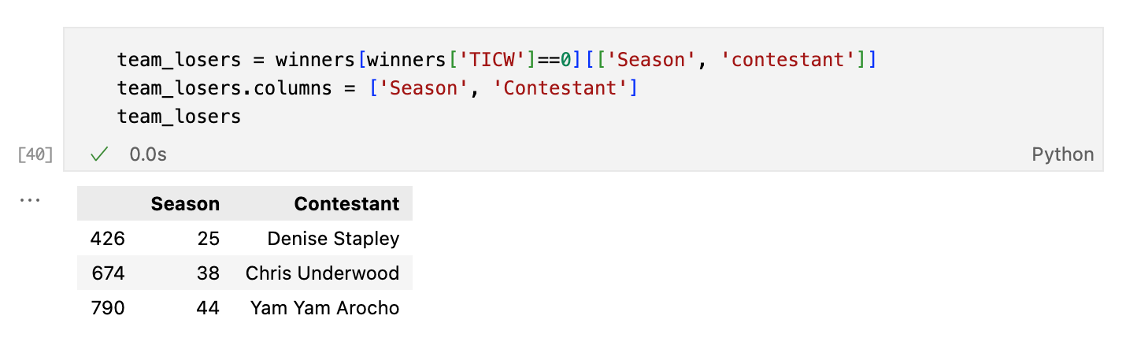
Next, we examine team immunity challenges, which are physical competitions at the team level that allow the winning team to avoid voting out a player. Which of the eventual winners won the fewest team immunity challenges? Apart from Chris Underwood in Season 38, who spent much of the season in exile, these winners had to participate in every tribal council throughout the season. This also means they had the fewest possible former tribe mates on the jury. What an impressive path to victory!
Voting Record Stats
After the challenges, the players must go to tribal council and vote for who they think should go home. I wanted to look at how often the winners were on the right side of the vote. The stat that measures this is vote for boot percentage, which indicates the number of times a player voted for the person who ended up going home. I first identified which of the players were on the right side of the vote every single time.

Next, upon noticing that this is more common in the earlier seasons, I was interested in seeing if this feat has become more difficult as the game has become more complicated over time. How has voting record changed as seasons have gone on?
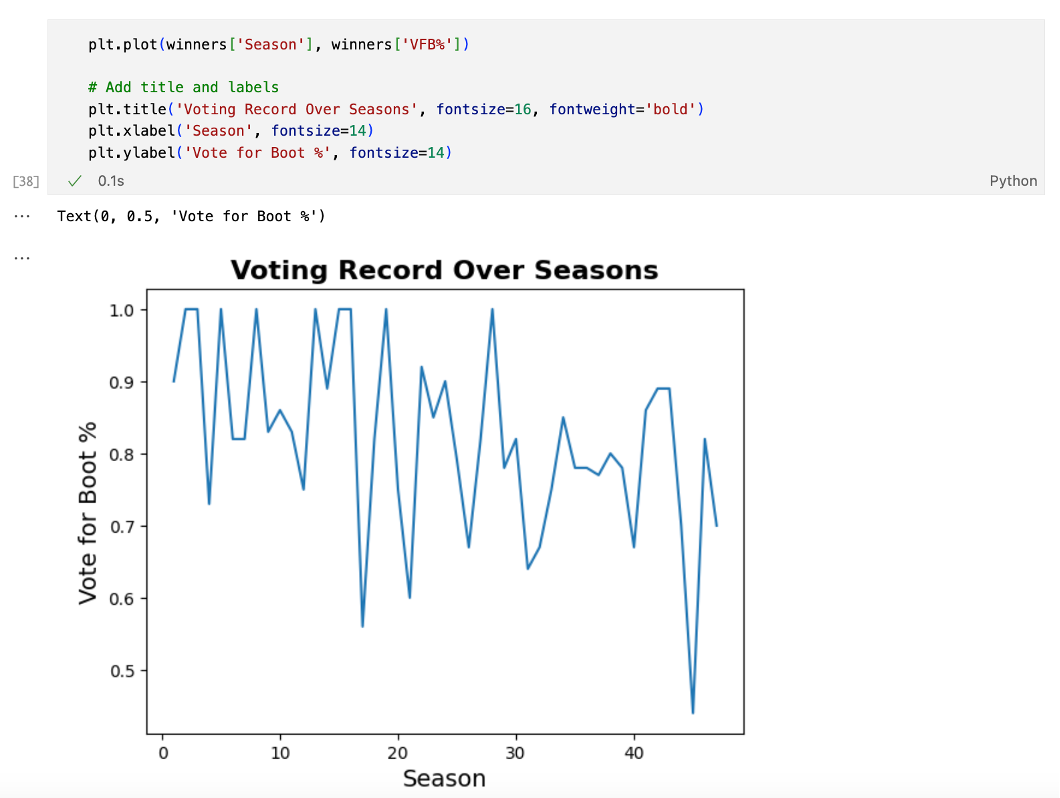
It appears that voting record is decreasing over time, meaning it is becoming more difficult to be on the right side of the vote.
Idol Stats
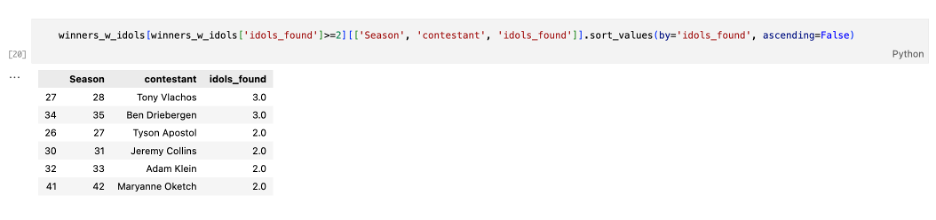
One final essential element of the game is immunity idols. These idols are hidden somewhere on the island and, if found, can be played to avoid being voted out. Which winners found the most idols during their season?
While finding idols is impressive, they only help in the game if you know when to use them. Which of the winners used their idol to avoid being voted out?

Model Building
After exploring the data, I’d like to use these stats to see if I can predict the winner of the season!
Feature Engineering
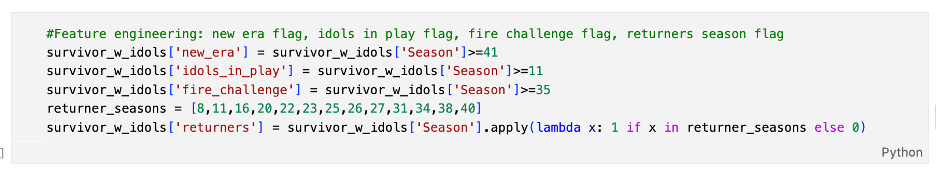
Any long-time viewer of the show will know that the game has changed dramatically over time. What used to be a simple survival show has become a complex game of deceit full of twists, advantages, and strategy. To account for this in modeling, I created some flags for different milestones in the game: the introduction of immunity idols, the fire challenge, and the so-called "new era" after season 40 (if you know you know). I also flagged any seasons that included returners, where I'd expect gameplay to be significantly different.
Modeling
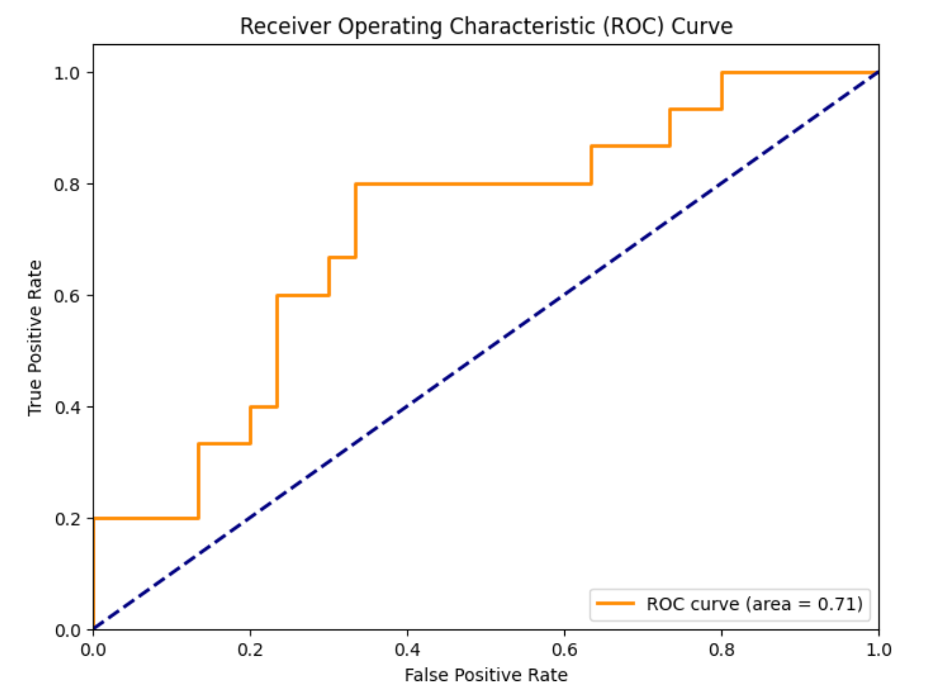
I prepare the data for modeling by establishing my list of features, create my target (winner), and split into training and testing data. For my train-test split, I divide it by season since we want to be able to identify the winner of a season without training on anyone else from that season. I use XGBoost and a grid search to find the optimal hyperparameters for my model. Finally, I plot the ROC curve to determine an optimal cutoff and create a confusion matrix to see how well my model is performing on my data.
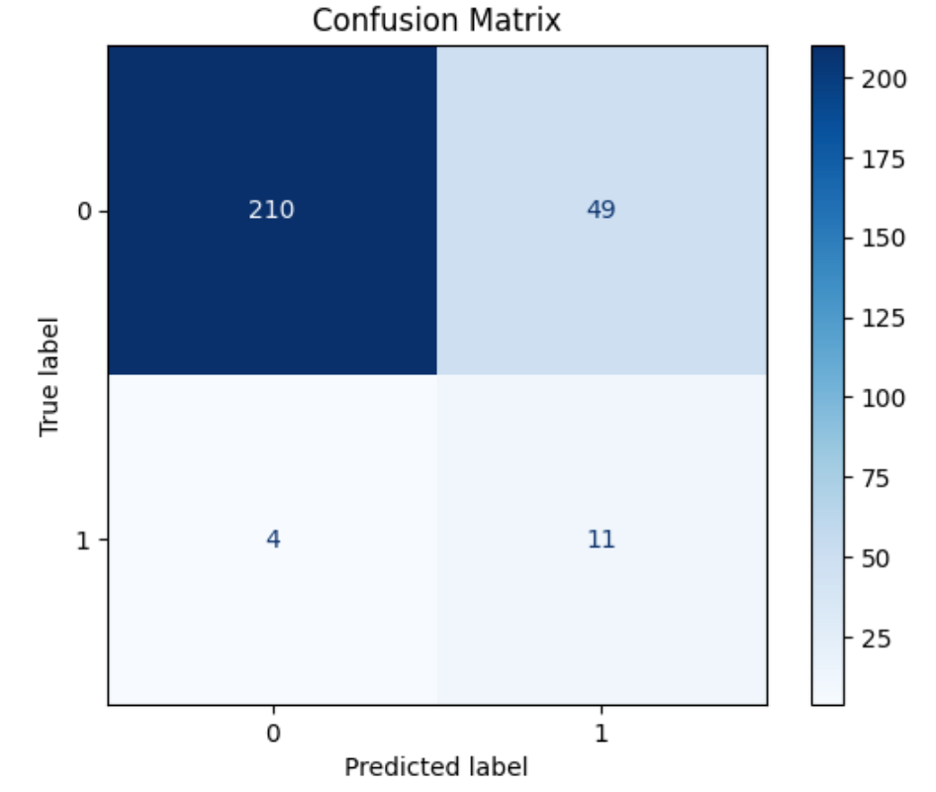
I created a confusion matrix from the model. The top left corner contains the contestants the model predicted to lose who ended up losing (true negatives), while the bottom right contains the predicted winners who ended up winning the game. False losers are on the bottom left and false winners are on the top right. Our model is doing a pretty good job of predicting which contestants are unlikely to be winners based on their stats and which contestants are in the running for winner status. However, this isn't helpful for predicting the winner. Since the stats are only determined when the gameplay is complete and the jury decides the winner, all players have good stats simply because they haven't been voted out yet. Therefore, we need to adjust the model to predict who will win among the finalists.
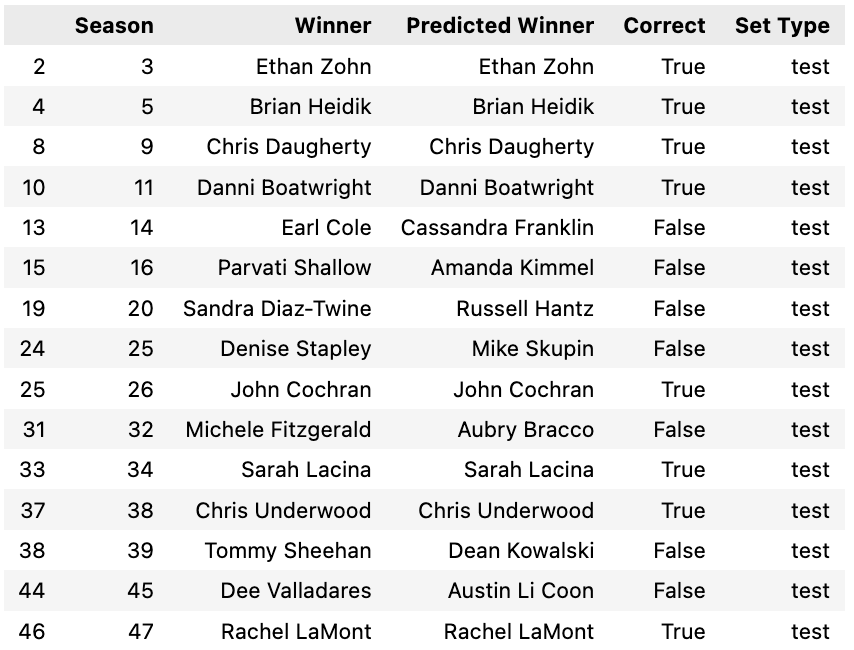
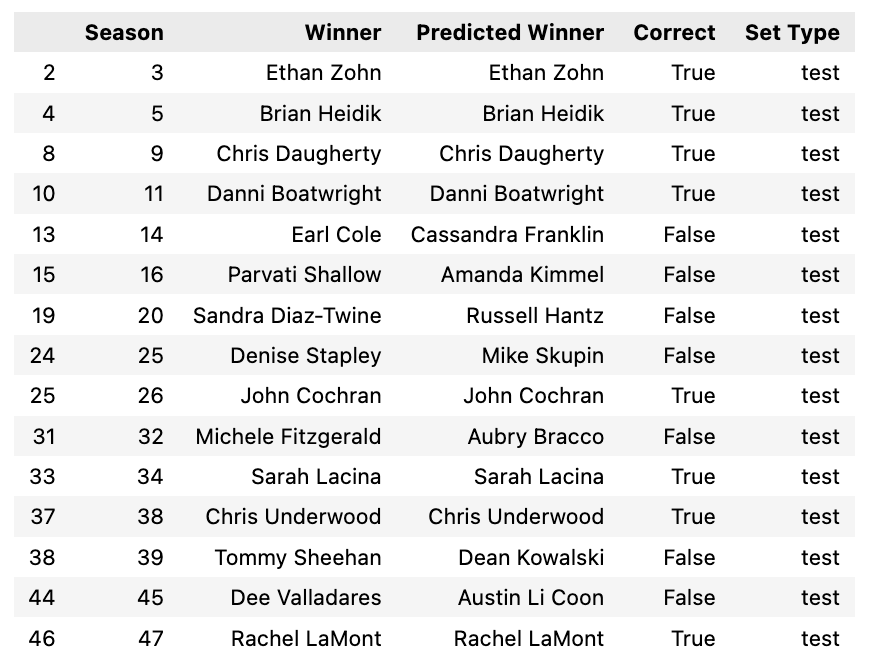
First, I'll test my theory to see how well our current model predicts among finalists. To do this, I'll list the winner of each season and compare it to the predicted winner based on the model's probability. I'll select the test seasons to evaluate the model's performance on the test data. We find that we have a 47% success rate, which is not much better than randomly choosing between the three finalists.
To see if I can adjust this model, I'll repeat the modeling process, training and testing only on finalists instead of the entire group.
We see that our model is slightly improved, but still only predicts the winner about 53% of the time. While it's disappointing to not be able to guess the winner correctly every time (and brag to my friends and family about my skills), it's interesting to see that the winner isn't determined solely by how well they do at challenges, voting, and idol play. There must be something intangible about these players that makes them a Sole Survivor!
To test this final theory, I created a logistic regression to see which factors are most statistically significant in determining a winner between the finalists. I used votes against the player, vote for boot percentage, individual immunity challenge win percentage, team challenge win percentage and number of idols played.
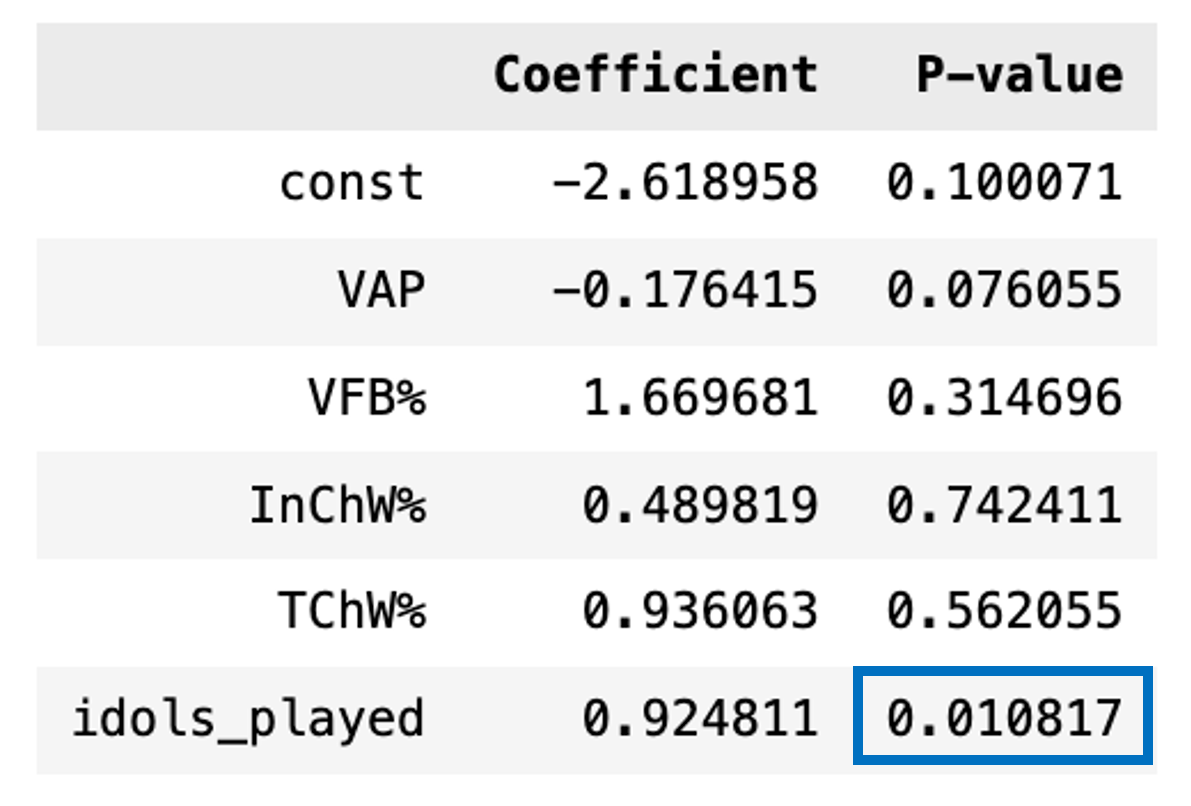
Based off the coefficients and p-values, we see that the only statistically significant variable of the main gameplay stats is number of idols played (because the P-value is below the significance threshold of .05). The other variables, votes against player, voting record, and challenge wins, are not statistically significant to a player's chance of winning. To me, this indicates that the social game, an element that cannot be measured and analyzed, is more important than any of the measurable gameplay elements!
If you are interested in seeing more detail on how I explored the data and completed the modeling process, you can look at my notebook on GitHub!
Use this dataset to explore yourself and see if you can create a more predictive model yourself!
Learn more
- SAS® Viya® Workbench Demo: Solving Your Productivity Challenges
- Download this e-book: Five reasons developers hit a productivity wall – and what to do about it
- Deeper enjoyment of your favorite shows -- through data
- From slopes to stats: Building a snowboarding performance dashboard with Python and my own sensor data
- SAS Viya Workbench & SAS Model Manager for Model Training and Deployment: SAS Models
- Visualizing our Netflix Trip through "The Office"

1 Comment
I love this analysis so much! Amazing work! I wonder if the data captured how many times a winner participated in a blindside or a very strategic move (this would earn my jury vote), or how many members of the jury the winner was aligned with, or if they flipped on an alliance etc. As you outlined, it's such a complex social game, and the winner has to not just make it to the final jury, but get the jury to vote for them!