SAS Viya’s geographic capabilities are highlighted with its inclusion of geocoding. Having to rely on incident locations written into data without latitudes and longitudes makes visualization less straightforward. Without geocoding, If the user has the location (eg. street address) but not the coordinates (latitude and longitude), the geographic objects would not be able to visualize it. But SAS Viya has incorporated a geocoding solution directly into the Manage Data tab, which allows us to use whatever geographic related values we’re given in the data (street address, postal/zip codes, city, Provence/state) to get a precise coordinate of the location.
The Geocoding Process
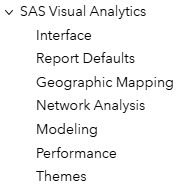
Before starting this process, the user must be signed into an ArcGIS Online account. This account must have available credits (money) attached to the account. Then in SAS Visual Analytics, the user must sign into their ArcGIS account in the users’ settings (Figures 1 and 2). If for any reason the option to sign in is not there, ask your administrator to grant you geographic mapping permissions from the Manage Environment user groups.

Once signed in, the user needs to bring in a table that contains some sort of geographic-related values. For this example, I will use basic street addresses. The addresses are accompanied by all the relevant geographic data we have available to us: the Address, City, Provence, etc. (Figure 3).

The user can bring this dataset into SAS under the Manage Data module. If the file is not already in SAS Viya or in a database connected to SAS Viya, then the user will need to upload the file, in Manage Data, and then continue onto the next step.
Once the file is in the system and the user is signed in to an ArcGIS Online account, the ESRI options become available (Figure 4).
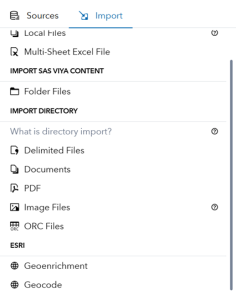
Select Geocode and the file that has the user’s geographic data. Then, a screen appears with all the columns in the dataset. Select only the columns that contain the relevant geographic data (Addresses, city, postal code), not any data that does not relate to geography such as people’s names or incident type (Figure 5).
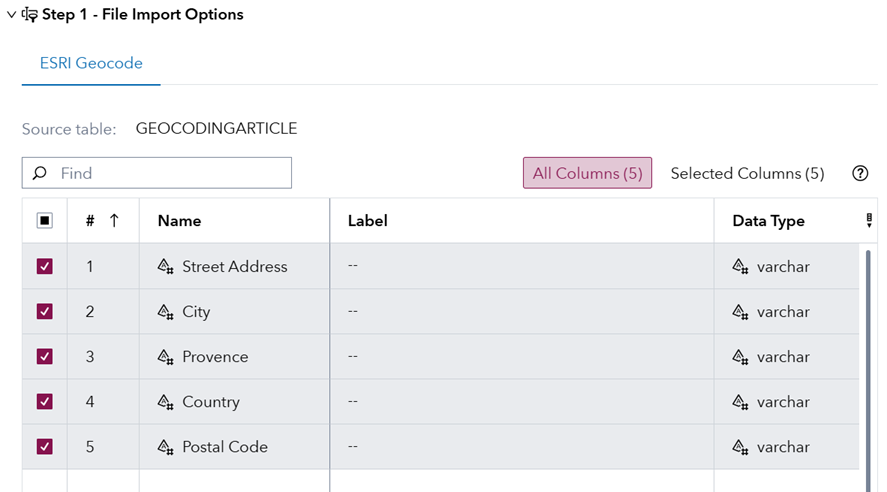
Once selected, the user can ‘test’ the data and see if it will produce an ESRI score. These scores are ESRI’s way of indicating how accurate the system was at pinpointing a latitude and longitude for that particular row of data.

Now select ‘Import Item’ and the software displays a pop-up screen, indicating how many ArcGIS Online credits will be used for this geocoding procedure.
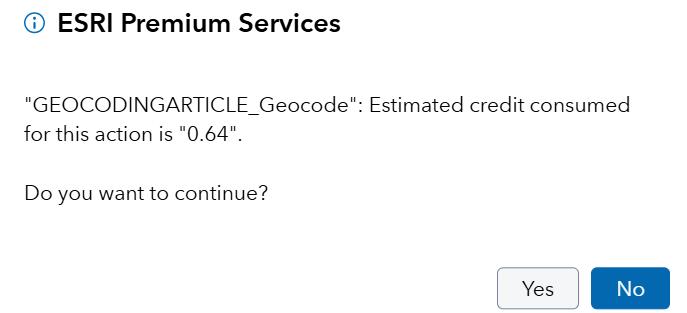
Selecting ‘Yes’, the user will generate a new dataset that is identical to the original dataset but with 4 new columns. Esri_address, is a category that is the cleaned up version of all of the columns selected for the geocode (Figure 5 again). Esri_latitude and esri_longitude are the latitudes and longitudes that the geocoding has created. Lastly, esri_score is the previously mentioned accuracy score.
Now the user must create a new geography item, use ‘Latitude and Longitude in data’ for the geography data source and select the corresponding ESRI values (Figure 8). The coordinate space will be generated as WGS84.
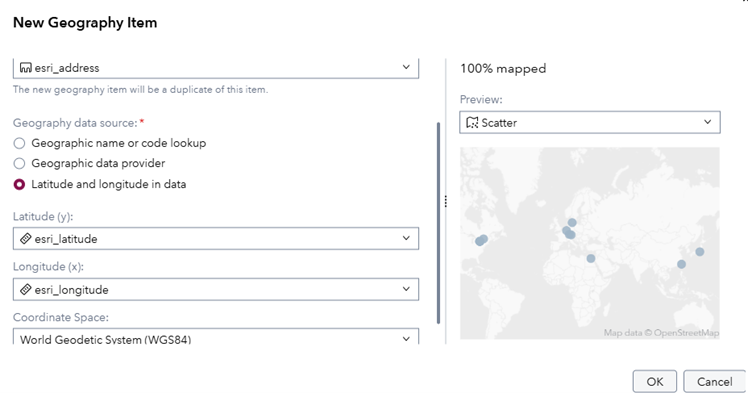
Once completed, the user can use this geography item on any geography object that uses points as the data source (GeoCoordinate, Geobubble, etc.)
The ESRI Scoring System
The ESRI score indicates how accurate the geocoding process is. By giving the system as much data as possible we can see how accurate it can be. The example I will use for this is the address of 220 Yonge Street. However, the system is given different levels of data specificity in each row (Figure 9). Each row has one more column of information than the last. With Yonge Street being the longest road in the world, it will have plenty of addresses duplicated along it.

In Figure 9, we see that the score fluctuates when given only the 220 Yonge Street address, the address and the country and then only gets to 100% accuracy once it has provincial data.

In Figure 10, we see that the first two ESRI addresses are wrong. The first is in a completely different country, the second is on the correct street in the correct country but not at the intended location (it is placed a few kilometers north in Eglinton). Once we give the system more data, it can see where we are trying to place the address. The final two rows show the correct intended address. Even though ESRI gave itself a high score on the first two rows, and was wrong, it tried its best to find where it thinks the user wants to pin point. In the geocodes defense, it has correct addresses for the context we provided, just not enough context is given.
City Center
Geographic data isn’t provided in every dataset. Sometimes for relevant data, only cities are provided as categories. This usually has to do with where sales teams are located, etc. But to map off this limited data, we can still geocode. In Figure 11, I provided two cities, let’s see where geocoding cities without specific addresses point us.

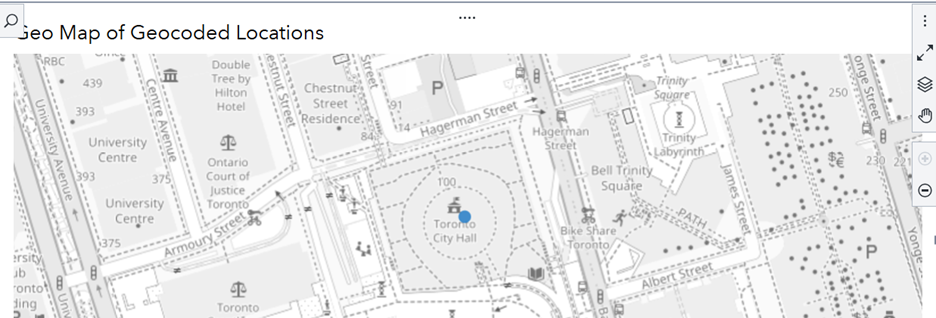
Figure 12 shows that without an address the geocoded location becomes that cities town hall. This location for Toronto pinpoints Toronto’s city hall and for Ottawa pinpoints its Parliament building (That is Canada’s Capital building). The geocode will point to the most important governmental building within the city.
Geocoding Different Languages
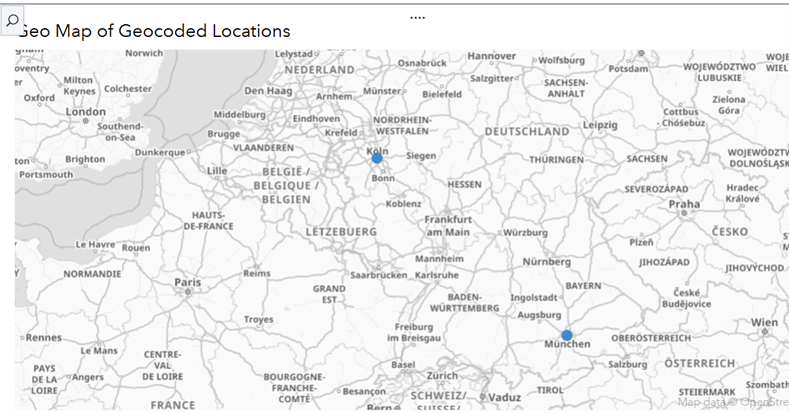
The geocoder allows users to use data of different languages without having to run any special process for doing so. In the same process outlined above, the user can geocode these locations (Figure 13).

These two locations are pinpointed to each of their respective city centers (Figure 14).
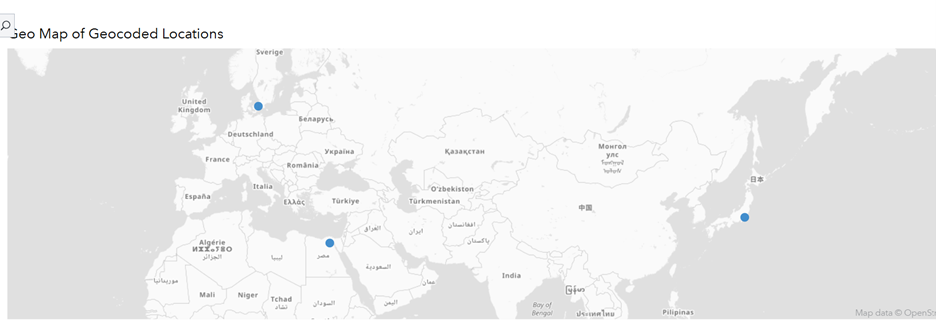
Geocoding can also work in different language alphabets (Figure 15). Cairo written in Arabic, Tokyo written in Japanese, and Copenhagen written in Danish, can all be geocoded and located on a map (Figure 16).

Geocoding Approximate Areas
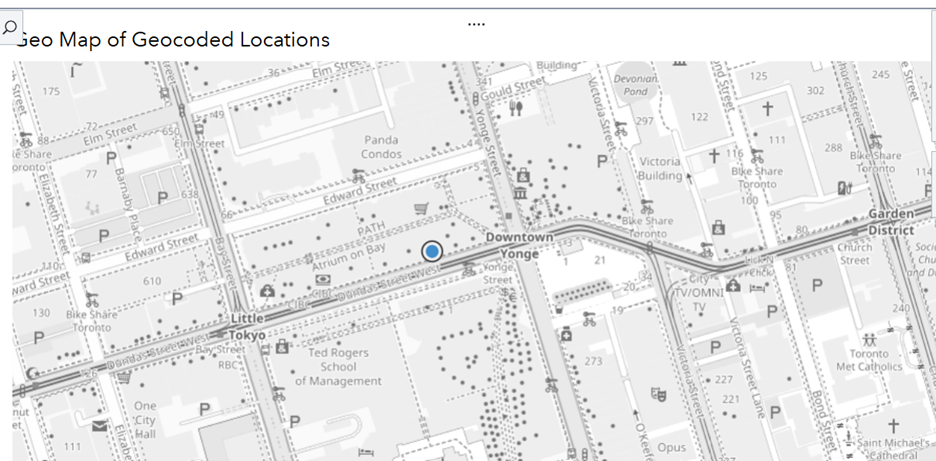
Sometimes the data isn’t complete enough and can only give an approximate area. The geocoder can solve this as well. Giving general intersections or parks can direct us in the right path. In Figure 17, we have Yonge-Dundas Square in the data. The area of Yonge-Dundas Square in Toronto is a well-known area. The geocoder can get us close to it just by using that name. It is not exact, but it is within a 50-meter radius.
Summary
This article was written to give insight on how the geocoding process is conducted as well as some of the capabilities it has built in. It can parse data and create a pinpointed address based off what is provided, and then give itself a score based on how accurate it believes it is. This gives us a streamlined way to take data with no location coordinates and visualize the data without having to go through and find each location ourselves. It can provide us locations on city centers and approximate areas within our data. It can also geocode in different languages and alphabets so that we can be accurate on a global scale. The ESRI geocoder can give our data much needed context and capability to visualize through geo-mapping.
Learn More
READ MORE | More from the same author about project status and optimizationREAD MORE | More from the same author about simulating theme park wait times
