Group and aggregate CAS tables
Welcome to the continuation of my series Getting Started with Python Integration to SAS Viya. In previous posts, I discussed how to connect to the CAS server, how to execute CAS actions, and how to summarize columns. Now it's time to focus on how to group and aggregate CAS tables.
Load and explore data
First, let's load some data. In SAS Viya we can use the Samples caslib for demonstration data. I'll load the data into the distributed CAS server using my CAS connection object conn, followed by the loadTable action. The loadTable action loads a server-side file into memory. Then I'll reference the CAS table in the tbl object and preview 5 rows using the SWAT head method. Remember, the data in this example is small for training purposes. Processing data in the CAS server's massively parallel processing environment is typically reserved for larger data.
conn.loadTable(path = 'WATER_CLUSTER.sashdat', caslib = 'samples', casOut = dict(caslib = 'casuser')) tbl = conn.CASTable('water_cluster', caslib='casuser') tbl.head() |
The water_cluster CAS table contains daily water usage for a variety properties. The Daily_W_C_M3 column displays the water used per location in cubic meters (m3), the Serial column identifies each property, and the Weekend column identifies if the reading occurred on the weekend or not.
Using the SWAT groupby method
The SWAT package contains the groupby method. It is defined to match the pandas.DataFrame.groupby() method. For example, I'll specify the CAS table object tbl, then the groupby method and specify the Serial column, and then enclose it with the type function to view the object.
type(tbl.groupby('Serial')) # and the results swat.cas.table.CASTableGroupBy |
Notice the results return a CASTableGroupBy object. This works similarly to the pandas DataFrameGroupBy object. This enables you to add aggregation methods to aggregate by groups. For example, what if you want to see the total water consumption for each Serial value?
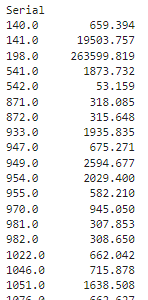
First, specify the CASTable object tbl, followed by the groupby method to aggregate by each Serial group. Then specify the column to aggregate, Daily_W_C_M3, and then add the sum aggregation method. Here the results are stored in the variable df_serial and displayed.
df_serial = (tbl ## CAS table reference .groupby('Serial') ## Group the CAS table .Daily_W_C_M3 ## Specify the CAS table column to aggregate .sum() ## Specify the aggregation ) display(df_serial) |

The code executes in the distributed CAS server and returns a Series object to the client. Once you have a Series on the client you can work with it as your normally would in Pandas.
Let's answer another question, is water consumption higher on the weekend or weekday? Using the same technique from above, let's view the mean water consumption on weekends and weekdays. I'll begin by specifying the CASTable object followed by the groupby method to group the Weekend column. The Weekend column indicates if it's a weekend, 1, or a weekday, 0. Then I'll specify the CAS column Daily_W_C_M3 and the mean method. Lastly, after the CAS server processes the data in parallel it returns a Series to the client. On the client-side Series object I'll chain the rename method to rename the values 0 and 1 to Weekday and Weekend respectively.
(tbl ## CAS table reference .groupby('Weekend') ## Group the CAS table .Daily_W_C_M3 ## Specify the CAS table column to aggregate .mean() ## Specify the aggregation .rename({0:'Weekday', ## Rename the values in the Series object returned from the CAS server on the client 1:'Weekend'}) ) |
The results show that water consumption seems to be higher on weekends.
Using the CASTable groupby parameter
You can also achieve the same results using the CASTable object with the groupby parameter. For example, what if I wanted to answer the same question as the previous example about water consumption on weekends vs weekdays?
First, let's display the parameters of the tbl object using the params attribute.
tbl.params # and the results {'name': 'water_cluster', 'caslib': 'casuser'} |
The results show the CASTable object has the name and caslib parameters. The name and caslib parameters simply reference the CAS table.
Next, add the groupby parameter to the tbl CASTable object with the column or columns to group by. Here I'll specify the Weekend column.
tbl.groupby = 'Weekend' # and the results CASTable('water_cluster', caslib='casuser', groupby='Weekend') |
Notice that the CASTable object now contains the groupby parameter with the value Weekend. I'll confirm that groupby parameter was permanently added to the CASTable object by checking the parameters of the object again.
tbl.params # and the results {'name': 'water_cluster', 'caslib': 'casuser', 'groupby': 'Weekend'} |
The results show the groupby parameter was added to the CASTable object. Now I can simply use the CASTable object to aggregate by the group. Specify the CASTable object followed by the CAS table column to aggregate. Then add the mean aggregation method to aggregate the data by groups on the CAS server. Lastly, the rename method will rename the Series object returned by the CAS server on the client.
(tbl ## CAS table reference with the groupby parameter .Daily_W_C_M3 ## Specify the CAS table column to aggregate .mean() ## Specify the aggregation .rename({0:'Weekday', ## Rename the values in the Series object returned from the CAS server on the client 1:'Weekend'}) ) |

Notice the results are the same.
Summary
The SWAT package blends the world of Pandas and SAS, making available many familiar Pandas techniques to work with your distributed CAS tables. This enables you to utilize the massively parallel processing power of the CAS server in SAS Viya using Python. Here we learned about using the familiar Pandas groupby method in the SWAT package and the CAS table groupby parameter to aggregate CAS tables by groups.

