I remember the first time I was faced with the challenge of parallelizing a DATA step process. It was 2001 and SAS V8.1 was shiny and new. We were processing very large data sets, and the computations performed on each record were quite complex. The processing was crawling along on
Tag: tips and tricks
With any software program, there are always new tips and tricks to learn, and nobody can know them all. Sometimes I even pick up tips or techniques from my students while they’re learning broader programming tips from me. Like fine wine, instructors only get better with age. Every customer interaction
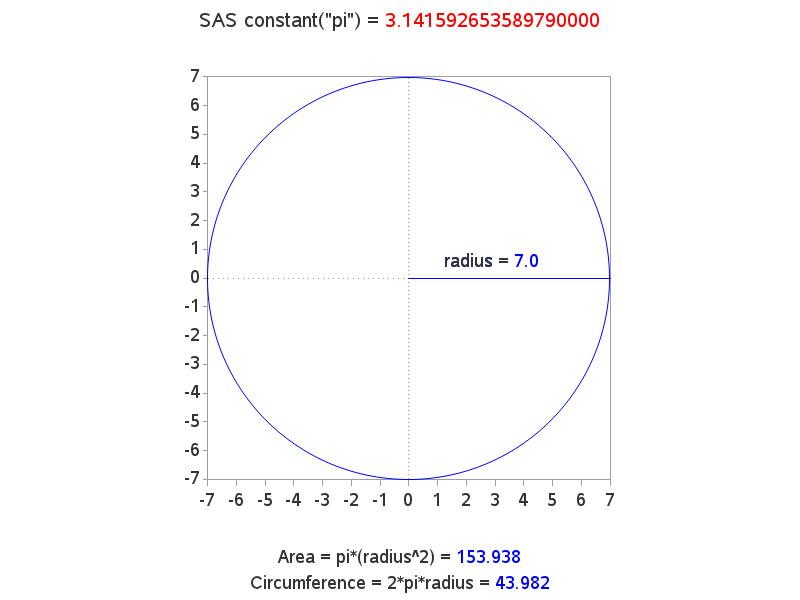
With Pi Day coming up on 3/14, I wanted to make sure all you SAS programmers know how to use the pi constant in your SAS code... All you have to do is use constant("pi") in a data step, and you've got the value of pi out to a good many decimal places
While perusing the SAS 9.4 DS2 documentation, I ran across the section on the HTTP package. This intrigued me because, as DS2 has no text file handling statements I assumed all hope of leveraging Internet-based APIs was lost. But even a Jedi is wrong now and then! And what better
A student in a SAS class recently asked if there were a way to eliminate data error notes from the SAS log and, instead, write them to a separate file. Of course there's a way! Here's a simple datastep. Notice the missing dollar sign to indicate the variable GENDER (M,
A student brought in this coding problem after her manager was struggling with this issue for a while. They played guessing games, but to no avail. Here’s what happened when they submitted data step and proc sql code using a WHERE clause with an INPUT function? data aileen; length hcn
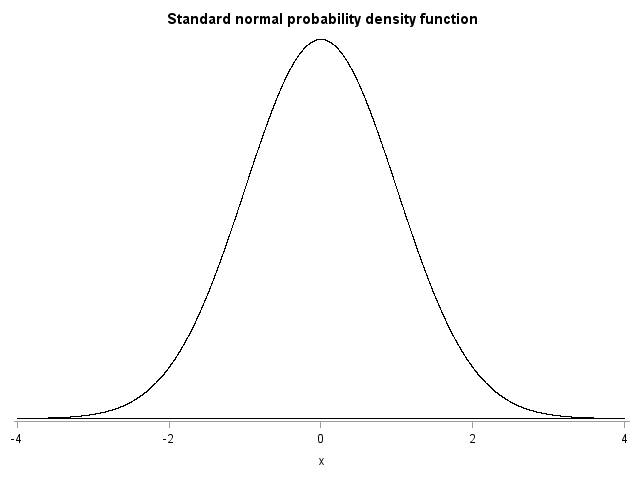
When teaching statistics, it is often useful to produce a normal density plot with shading under the curve. For example, consider a one-sided hypothesis test. An alpha value of .05 would correspond to a Z-score cutoff of 1.645. This means that 95% of a standard normal curve falls below a
This SAS tutorial video will show you how to generate plots for two continuous numeric variables with Base SAS. Basic scatter plots, linear or curvilinear regression lines, confidence intervals or ellipses, and multiple plot overlays are demonstrated. To learn more about this topic, check out our SAS Programming 1: Essentials
In this tutorial video, you will learn to print a simple listing with Base SAS. You see how to write a PRINT procedure step to display a SAS data set. You also see how to use statements and options to subset observations and variables and enhance the report. Learn
These two tutorial videos will show you how to filter and sort data in Base SAS. In this first video, you will learn to use a WHERE statement in Base SAS to filter or subset SAS data. Data sets can be very large and filtering data enables you to select