SAS Learning Post
Technical tips and tricks from SAS instructors, authors and other SAS experts.
Editor's note: This series of blogs addresses the questions we are most frequently asked at SAS Press! It worth spending some time on this. Arguably, this is one of the most important parts of the book. The table of contents and outline provide the blue print of your book –

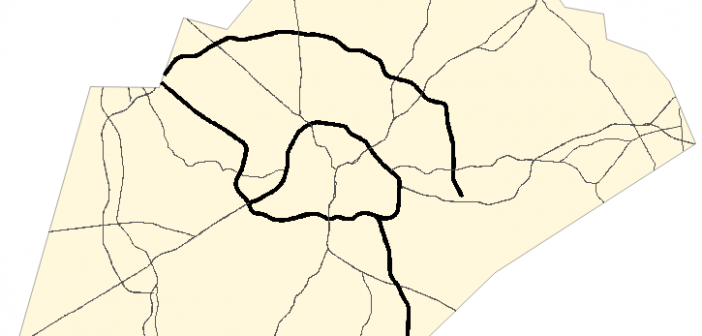
Have you been using the SAS/Graph Gmap procedure to plot your data on maps for years, but never knew you could add roads to your maps?!? Follow along in this blog post, and I'll teach you how... But before we get started, here's a picture of a nice aerial view

Editor's note: This series of blogs addresses the questions we are most frequently asked at SAS Press! In our last post about how to write a good outline, we discussed the importance of developing an outline for your proposed SAS Press book and gave some tips on how to do

