SAS Learning Post
Technical tips and tricks from SAS instructors, authors and other SAS experts.
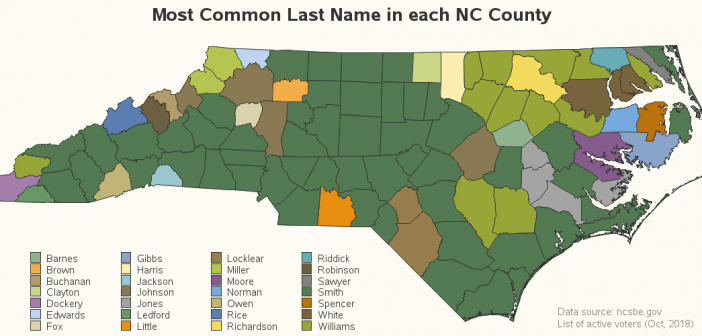
The other day I was playing around with the voter registration data for all ~8 million registered voters in North Carolina (yes - this guy knows how to have fun!), and I got to wondering what last names were the most common. I summarized the data by county, and the

This past Sunday was the last day of the NC State Fair, and we broke some records this year! Can you guess what those records were? I'll ramble on about the fair to give you time to come up with your guess, and then I'll let you know about the

Have you noticed a lot of graphs popping up lately, about politicians, voters, and elections? ... Well of course - it's an election year! If you follow my blog posts, then you're probably a bit "smarter than the average bear" when it comes to scrutinizing graphs. And election graphs election
