You should play a little. Add dots. Add color. Your PROC REPORT output does not have to be boring. As a matter of fact, it can be both functional and appealing.
Any Unicode value will do, but this blog shows how to use the Unicode value for a dot (filled circle) to display test results, not as numbers or text, but as colored dots. The color of the dot indicates the severity of the test.
Your data set probably has a variable that contains the results of the test. For this example, the test result is numeric but you can modify the example to work for a text value as well. Your data set does not have to change. SAS formats will do the heavy lifting of displaying the dot and applying the color.
Here is the full code:
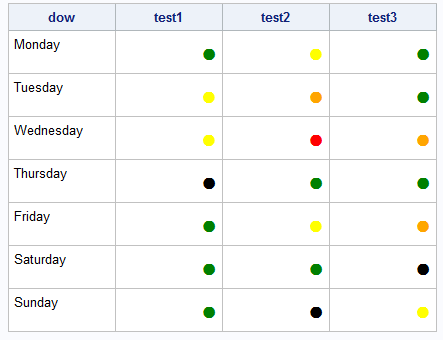
/*Create test data*/ data a; length dow $10; input dow $ test1 test2 test3; datalines; Monday 1 2 1 Tuesday 2 3 1 Wednesday 2 4 3 Thursday 0 1 1 Friday 1 2 3 Saturday 1 1 0 Sunday 1 0 2 ; run; /*Create a color format and a dot format unicode 25cf is a dot (filled circle)*/ proc format; value cfmt 4='red' 3 ='orange' 2='yellow' 1='green' 0='black'; value dot low-high='^{style [just=c fontsize=20pt]^{unicode 25cf}}'; run; ods escapechar="^"; /*Apply formats to test values*/ proc report data=a style(column)=[width=1in]; column dow test1 test2 test3; define test1 / style(column)=[foreground=cfmt.] format=dot.; define test2 / style(column)=[foreground=cfmt.] format=dot.; define test3 / style(column)=[foreground=cfmt.] format=dot.; run; |
The PROC FORMAT step creates two formats. The first assigns a color to each level of the test. The second format assigns all possible values to the Unicode value 25cf.
In the PROC REPORT step the format for the color is applied to the FOREGROUND= attribute. The format with the Unicode value is assigned in the FORMAT= option.
You might have seen the code above, or something like it, before. Lots of reports add traffic lighting and symbols. What might have caught your eye is the extra styling attributes in the format for the dot, [just=c fontsize=20pt].
The desired result is to have the dot both horizontally and vertically centered. The default style template for each ODS destination should vertically center the dot, so you don’t have to worry about adding an attribute for that control. However, you do need to tell the ODS destination to horizontally center the dot within the cell.
Achieving the desired look takes a slightly different code strategy depending on which ODS destination you are using. If the justification attribute just=c is left out, the dots are right aligned in both HTML and PDF.
The just=c attribute can be applied within a DEFINE statement.
define test1 / style(column)=[foreground=cfmt. just=c] format=dot.; |
This works for the HTML output:

but not the PDF output:
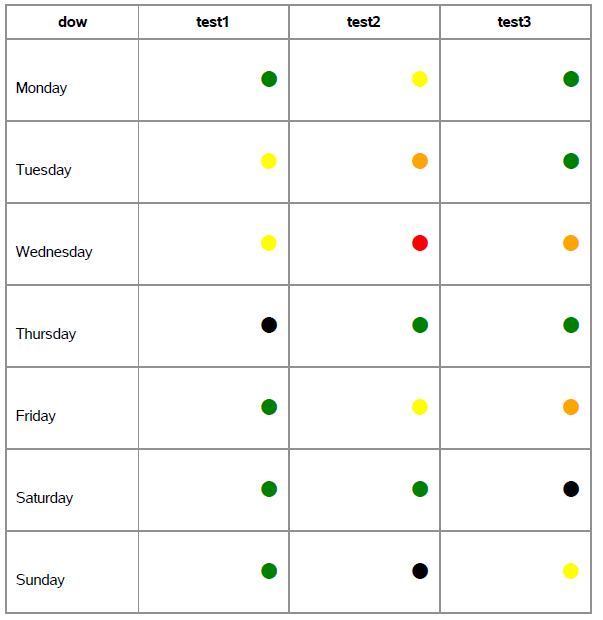
For the PDF output you need to add the justification attribute to the format where you create the dot, '^{style [just=c fontsize=20pt]^{unicode 25cf}}'.

In this example adding the justification to the DEFINE statements works for HTML and not PDF. Conversely, adding the justification to the format works for PDF and not HTML. The example demonstrates the importance of developing code based on the destination you are using for your final results.
For more examples of controlling styling in PROC REPORT tables in the common ODS destinations, check out my book The SAS® Programmer's PROC REPORT Handbook: ODS Companion.

5 Comments
This is great (I've saved it for future needs)!
Right now, I'm looking for something where I can represent (using this same format),
- If three patients took Test 1 on Monday, and 2 passed, I want to show 2 green dots and 1 red dot in the "Monday / Test 1" box.
Same for all other boxes.
Any links or thoughts?
Am still loving this.
Hi Melissa,
This is a great question.
I put together a little example with the assumption that your pass and fail counts are in two different variables. You can then build a variable, inside of PROC REPORT or out, that contains the correct number of dots. You can probably make this code a little slicker, but hopefully you can see all of the necessary steps with this code. I also left the pass and fail columns visible but they can be hidden with the NOPRINT option.
data a;

length dow $10;

input dow $ test1p test1f;

datalines;

Monday 1 2

Tuesday 2 3

Wednesday 2 4

Thursday 0 1

Friday 1 2

Saturday 1 1

Sunday 1 0

;

run;
/*Create a color format and a dot format
unicode 25cf is a dot (filled circle)*/
proc format;
value cfmt
4='red'
3 ='orange'
2='yellow'
1='green'
0='black';
value dot
low-high='^{style [just=c fontsize=20pt]^{unicode 25cf}}';
run;
ods escapechar="^";
/*Apply formats to test values*/
proc report data=a style(column)=[width=1in];
column dow test1p test1f test1;
*define test1p / noprint;
*define test1f / noprint;
define test1 / computed width=150;
compute test1 / char length=1000;
length temp1 temp2 $450;
if test1p.sum > 0 then temp1=repeat(put(test1p.sum,dot.),test1p.sum-1);
else temp1 = '';
if test1f.sum > 0 then temp2=repeat(put(test1f.sum,dot.),test1f.sum-1);
else temp2 = '';
test1 = "^S={foreground=green}"||temp1||"^S={foreground=red}"||temp2;
endcomp;
run;
Cool!
Awesome - I've used this trick to put in sparklines, which is so much fun! And use stars every single month... Thanks for posting this!
I've used similar tricks a couple of times. Once to build a report with Harvey Balls (yes, you heard that right). And once to create a report with a stars-style rating system.