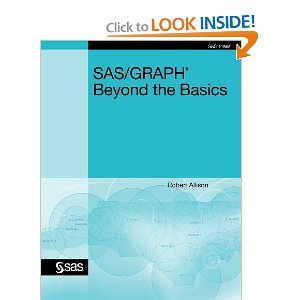
This SAS tip is from Robert Virgile and his book “SAS Macro Language Magic: Discovering Advanced Techniques”. We hope you find this tip useful. You can also read an excerpt from Virgile’s book. When CALL SYMPUT creates a new macro variable, it places that variable in “the closest non-empty symbol
English
Mount St. Helens volcano here in the US had a big eruption 35 years ago this week! Do you know exactly where it is located? Perhaps this SAS map can help... As you might have guessed, I'm a big fan of the awesome power of nature (hurricanes, tornadoes, lightning, earthquakes, and
Dataset too big for PROC PRINT? One weird trick solves your problem! proc print data=bigdata (obs=10); run; The OBS= dataset option specifies the last observation to process from an input dataset. In the above example, regardless of dataset size, only the first 10 observations are printed; an easy way to
Many of our authors often ask us where they can find real data that they can use without copyright or other confidentiality issues. Instructors too are always on the look-out for real-life data. Well, thanks to a new initiative supported by SAS, you can now access data from more than
As a kid, I was always intrigued with UFO sightings and I guess I'm still a little that way ... therefore how could I not jump at the opportunity to explore some UFO sightings data! I guess "UFO" doesn't necessarily imply that something is an alien space ship - just
Many colleagues and customers at SAS Global Forum ask me, why I write books beside having a full-time job as SAS consultant and being lecturer at universities. Valid question. SUSTAINABILITY. I have been working in so many analysis projects in different domains and industries. Some of them were longer, others were
In recent releases of SAS, you can use Output Delivery System graphics or 'ODS graphics on' to produce nice graphical output for most of the analytic procedures. These default graphs are nice, but when you want your graphs to look "a certain way" SAS also lets you create your own custom graphs!
I’m headed to Orlando, May 17- 20, for the annual PharmaSUG conference. PharmaSUG is the Pharmaceutical Industry SAS Users Group, consisting of professionals worldwide in the pharmaceutical and healthcare industries who use SAS software in their work. I will be at the SAS Publications booth in the demo room and
We have all heard the old joke about the person who sidles up to a doctor at a party and describes in great detail a medical problem a "friend" is having in order to get free medical advice. It could just as easily be a person buttonholing an accountant for
I was surprised to find that the size of the U.S. federal government is smaller today, than in the past many decades - let's graph it out, so it's easy to analyze... The way I got started on this little adventure was via Jishai's graph on dadaviz.com. Here's a snapshot