Were you the kid who sat there analyzing the amusement park map before entering the park, planning out how you could visit the most rides in the least amount of time? If so, then this blog's for you, my data analyst kindred spirit! And to get you in the mood,
English
The way your graph looks can make all the difference ... two people can graph the exact same data in essentially the same way, but one of the two graphs can be perceived as much better than the other. Hopefully reading my blogs will help you create the better graph!
In the spirit of our “40 and forward” theme to celebrate 40 years of SAS, this blog focuses on David Dickey, an accomplished SAS user since 1974 and a SAS instructor since 1981. He actually co-wrote the original Time Series SAS course in 1981, and helped with the most recent
One of my favorite quotes is: "You can't believe everything you read on the Internet" - Abe Lincoln, 1868. And that is especially true when it comes to graphs and statistics. Hardly a day goes by without me seeing a bad graph that misrepresents the data (either intentionally or unintentionally) .
SAS is kicking off a new event Sept. 12-14 in Las Vegas called the Analytics Experience. It’s actually not completely new. In the past, we’ve held our annual Analytics and Premier Business Leadership Series conferences in the fall. But as the industry landscape continues to change – SAS continues to
With the Pokémon Go craze sweeping the world, techies and programmers are looking to apply their skills to gain an advantage over the average user. In this blog post, I show how to use some of SAS' geospatial analytics capabilities to capture a Pikachu. Let's say you know of a building that has
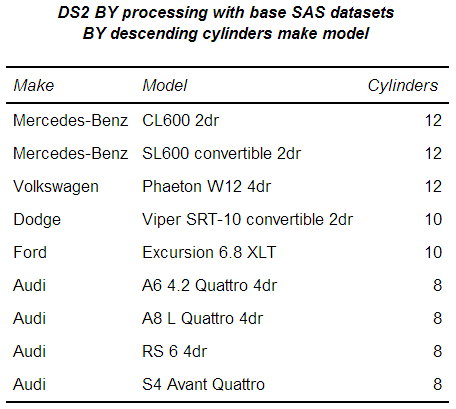
One of the things I’ve come to love most about DS2 is the tight integration with SQL which makes so many data prep chores so much less onerous. An example is DATA program BY group processing. With a traditional DATA step, you must first sort or index the source data
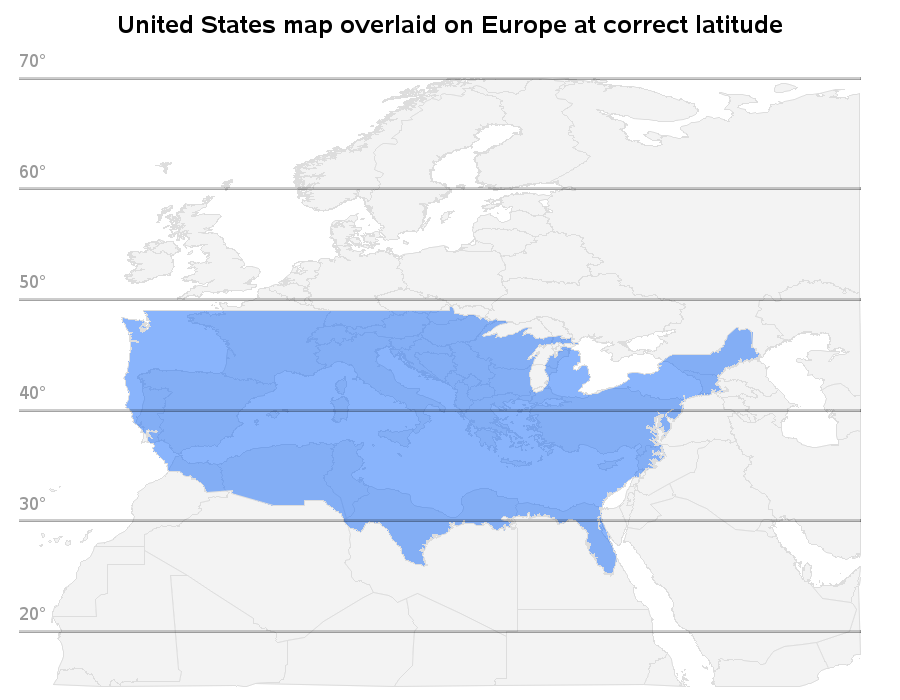
What would it be like if the US was in the EU? I don't know how that would work out politically, but this map shows how it might look geographically (if the US was literally picked up and moved to Europe!) My buddy Rick Langston is a bit of a
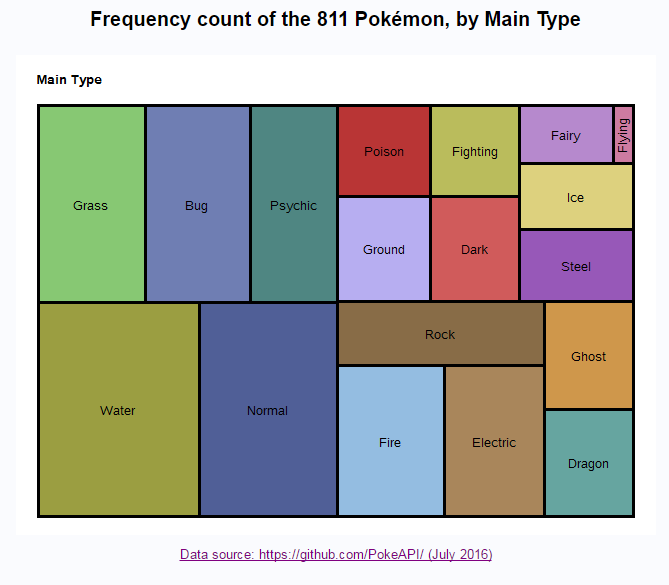
So, how many different Pokémon have you caught - and more importantly, how many different kinds are still out there that you haven't caught yet? I've created some graphs that might help you figure it out! I think my previous blog post might have irritated some of the hardcore Pokémon players out there
Are you caught up in the recent Pokémon Go craze? Or maybe just trying to figure out what all the fuss is about? In this blog post, I try to analyze all the important Pokémon-related data in one graph! When the original Pokémon game first came out around 1995, you needed