In the US presidential election, each of the 50 states has a certain number of electoral votes, based on the population. Typically, most states cast all their electoral votes for the candidate who wins in their state (all or nothing). But states can split their electoral votes if they want
English
Elections in the US are a 'target rich environment' for data analysts. There are surveys and forecasts before the election, and the presentation of results during and after the voting. What's your favorite election-related graph of all time? For the current (2016) presidential election, my favorite graphs are on the
My river walk last week turned into a spectacular fall show. But if it rains this week in San Antonio, like the weatherman predicts, what will I do? In the coming days, I’ll be presenting at two user groups, one in eastern Canada in Halifax, and the other all the
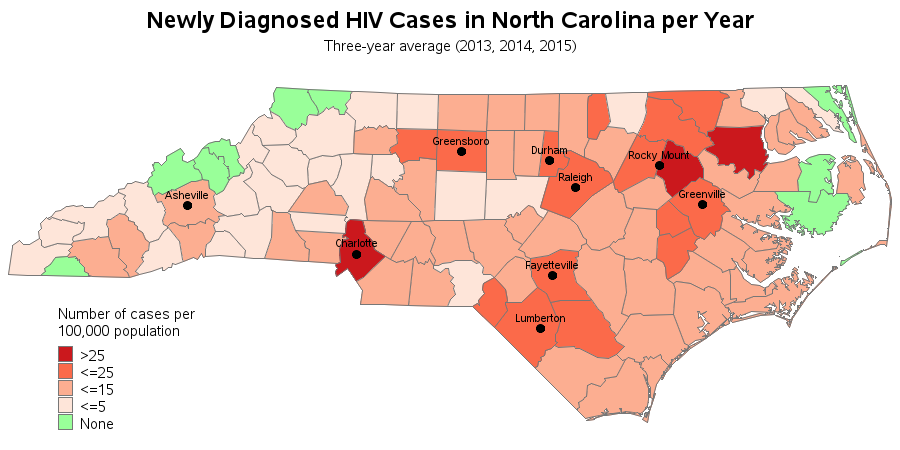
Being an Eagle Scout, the data for good movement caught my attention. I wondered if I could apply my computer skills in a way that might help. How about showing people better ways to visualize HIV/AIDS data - that might help doctors better understand the data, and therefore better treat
Halloween appears to be my favorite holiday, because I seem to have more graphs related to it than any of the others. And since Halloween is just a few days away, I thought you might like an easy way to see all those graphs. Here's are links to my previous Halloween-related blog
Like unexpectedly seeing this beautiful bird in nature, SAS has tons of free goodies you might be surprised to encounter as you explore your software. A user asked me how to find products licensed at their workplace and that's how this informative blog got started. While individual organizations may have
The State Fair in North Carolina is just a few miles from SAS headquarters, and therefore it's virtually impossible for it to slip by without me noticing it. There are two aspects of the fair that usually get lots of news coverage - what's the latest fair-food, and did we
SAS Enterprise Guide has come a long way since version 1.0 was released in 1999! Are any of you original users that remember the Help characters, Clippy, Peedy or Merlin? I was working as a statistician for another company that year, and I attended a SAS user group meeting where
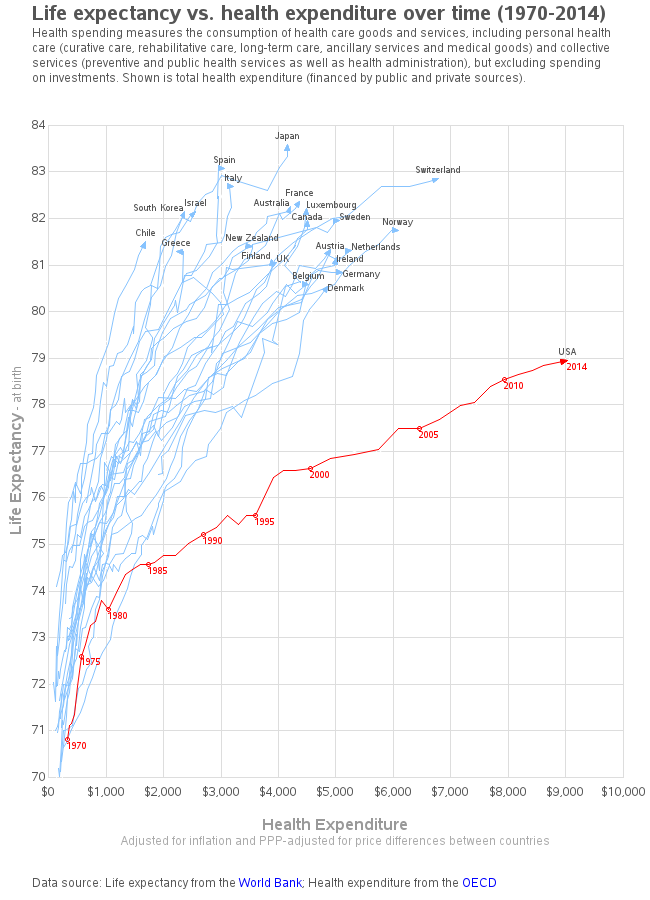
Living to 100 isn't as simple as just paying a certain amount of money for your healthcare. But that is an interesting aspect of longevity, so let's have a look at the data ... In my previous blog post, we analyzed how much people from various countries spend on healthcare.
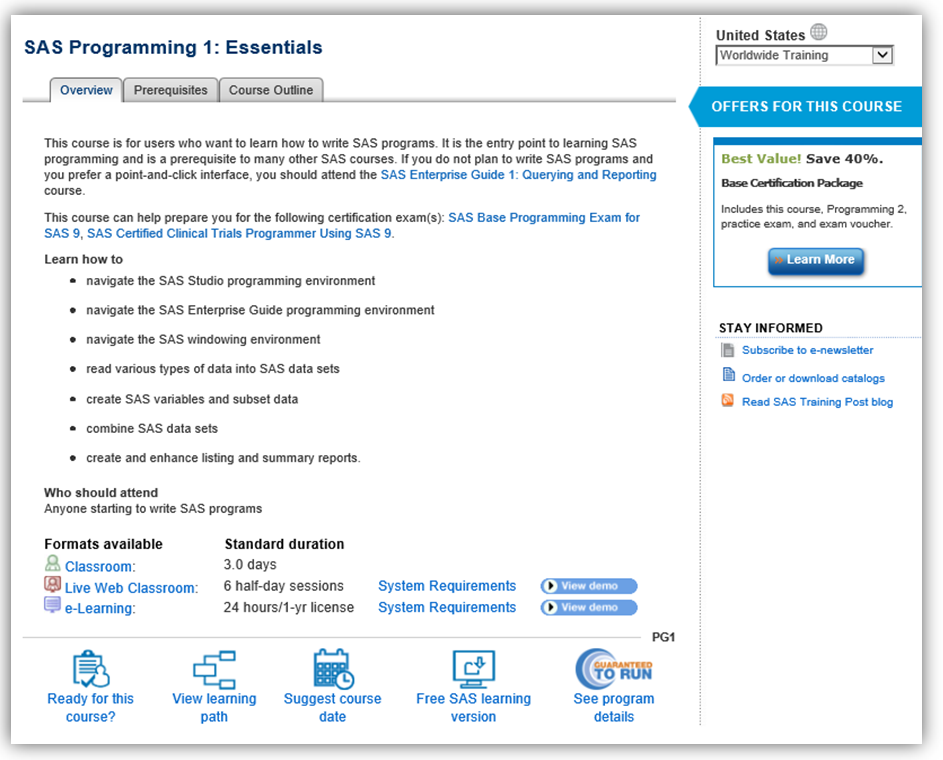
As an instructor for SAS, I receive a wide variety of queries before, during and after delivering my courses. Most frequently, I am asked questions such as: Should I learn SAS programming or a point and click tool instead? I know lots of code, should I go straight to the