I am all about sharing. Knock on my door and I will gladly lend you a stick of margarine, a cup of sugar, an egg or two, some flour, a corkscrew, or a beer. Not a problem to borrow a tie, one of my extra belts, a white shirt (if
Uncategorized
If anyone knows how to finesse insight out of data, it’s Bart Baesens, professor at KU Leuven (Belgium), and a lecturer at the University of Southampton (United Kingdom). Not only has he written a book about it, Analytics in a Big Data World: The Essential Guide to Data Science and
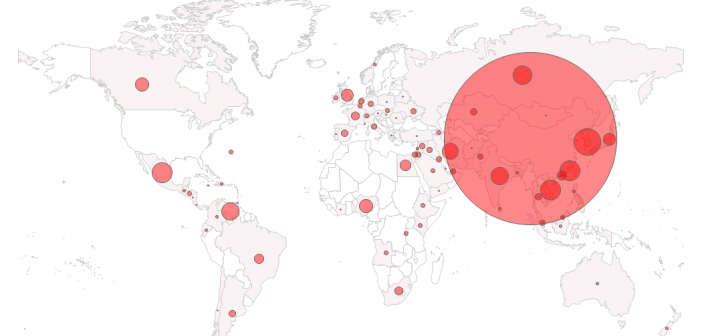
Data about the monthly wait times at VA facilities in the US are now available, but it's a bit overwhelming to try to analyze them in tabular form - plotting the data on a map made it a lot easier!... Here in the US, when our soldiers finish their commitment in
Has this year's flu been better or worse than you thought it would be? There are a lot of factors that help determine whether or not you're likely to get the flu. Is there a bad strain going around? Did the flu vaccine target the right strain? Did you get
After working as a flight attendant for more than 20 years, Lauren Guevara was ready for a new adventure. The inspiration for her journey came from an article she read in CNN’s Money magazine that highlighted the earning potential of a SAS Certification. Also having earned a Master of Science
How simple is too simple, when it comes to analyzing data on a map? The KISS principle can be applied to many things, including graphs and maps. What is the KISS principle, you might ask? Well, it's not the rock band that my friend Patricia (pictured below) has been known
So, how did you first learn SAS programming? Originally, I was self-taught. Many years ago, I learned SAS on the job when a systems programmer quit and I took over supporting a mainframe performance software package that was written in SAS. I got a copy of the Base SAS users
Election fever has hit the United Kingdom as the days count down to 7th May 2015. This is likely to be one of the most uncertain elections in recent memory, with nearly 10 parties struggling for votes across England, Scotland, Wales and Northern Ireland. Results night will be tense, with the different
Most SAS programmers have been here. Someone just wants a handful of numbers that they can add to a graph or power point presentation that is due tomorrow. You have the data files, you have a job to summarize it, and you have a dilemma. How do I get my
One of our customers asked if I could show him how to reproduce a stickman graph that David McCandless (ala, Information is Beautiful) had created - see screen capture below. I'm not sure that it's the best kind of graph for the occasion, but of course SAS can be used