Has this year's flu been better or worse than you thought it would be?
There are a lot of factors that help determine whether or not you're likely to get the flu. Is there a bad strain going around? Did the flu vaccine target the right strain? Did you get the flu shot? Has the weather been cold & wet? How has your health been poor in general? Have you had to care for family members who had the flu? Etc, etc, etc.
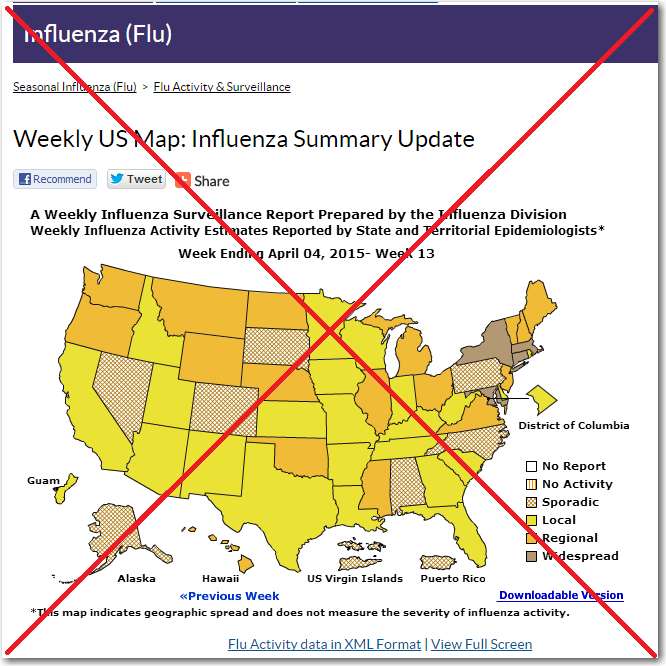
And I guess a lot of flu-factors get rolled into geography - if the flu is "going around" in your area, then you're probably more likely to get it. Which is why I was happy to find the CDC's flu map! It shows all the US states (and a few other areas) color-coded by the prevalence of the flu! Here's a screen-capture of their flu map:
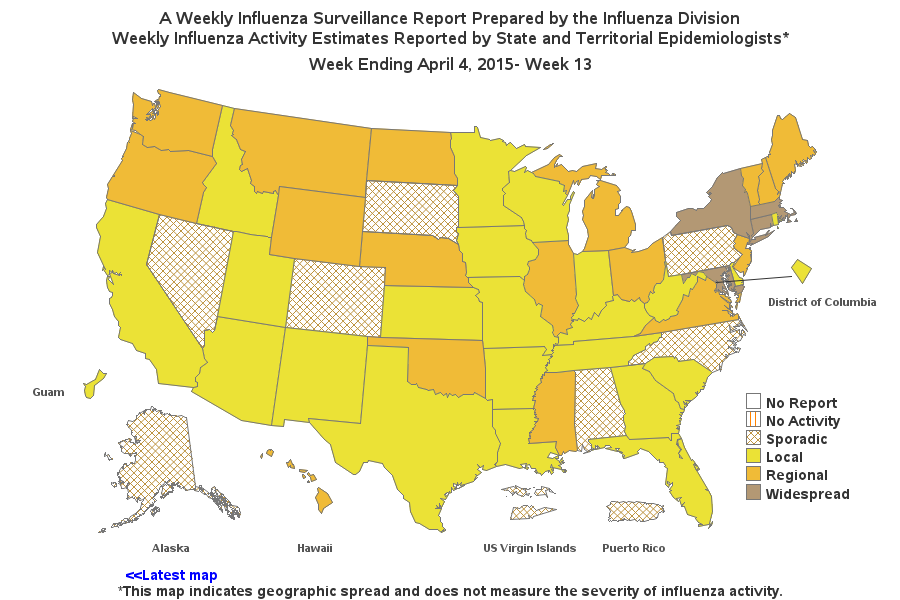
Of course, any time I see a nice map, I naturally want to try to create it in SAS. The CDC map only had 2 challenging aspects that I didn't know the exact code for, right off the top of my head. The first was the cross-hatch patterns - I knew SAS/Graph could do them, but I didn't know the exact syntax. After a quick visit to the pattern statement help page, I determined that the 2 special map patterns could be coded as m4x45 and m4n90. The second challenge was including the territories (such as Guam, US Virgin Islands, and Puerto Rico) in the US map. I decided to subset them out of the world map, re-size & re-scale the x/y coordinates, and then combine them with the US map. Here's a link if you'd like to see the exact SAS code that was used.
The results came out looking very close to the original (see below). And one extra bonus feature of my map is that I added html hover-text for each state - this can be helpful to anyone who is analyzing the data, but in particular allows vision-impaired people to explore the map using Voice-over technology (as the hover over each state, the state name and flu prevalence is read out loud). Click the map snapshot below, to see the interactive version with hover-text.
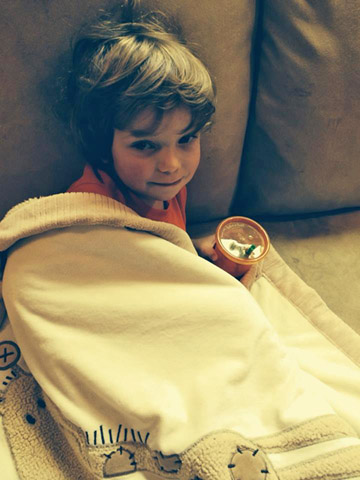
And now for the "Aww!!!..." part of the blog. Speaking of catching the flu by helping take care of sick family members, here are pictures two of my co-workers provided of their sick kids (still cute, even when sick!). Thanks Mary & Jennifer!