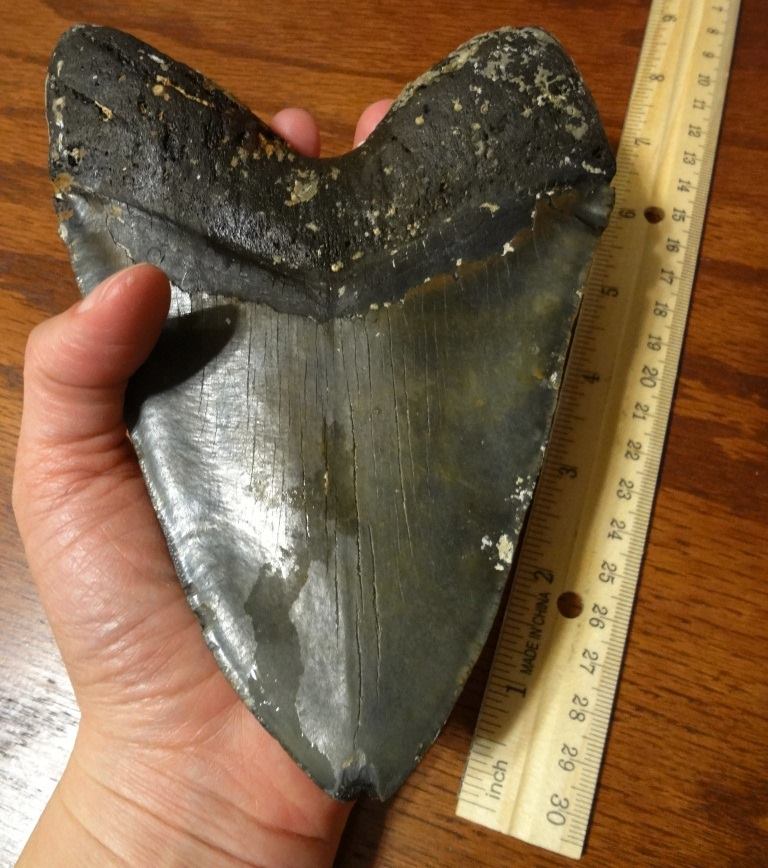
With Discovery Channel's Shark Week starting on August 10, I decided to sink my teeth into some shark-attack data - I even found there were some shark attacks in the Midwestern US! Read on to learn the details... To get you into the shark mindset, here is a photo of an
Author
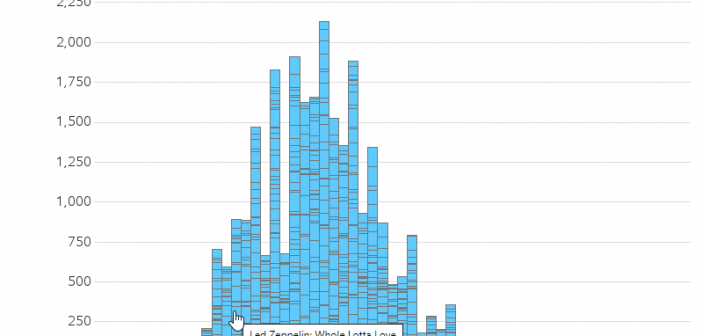
In this blog post, I put some classic rock song data under the SAS Analytics microscope, to see if I could get a better picture of exactly what is considered 'classic rock' these days... Michael Raithel recently pointed me to an interesting article/study about 'classic rock' music, and invited (or is
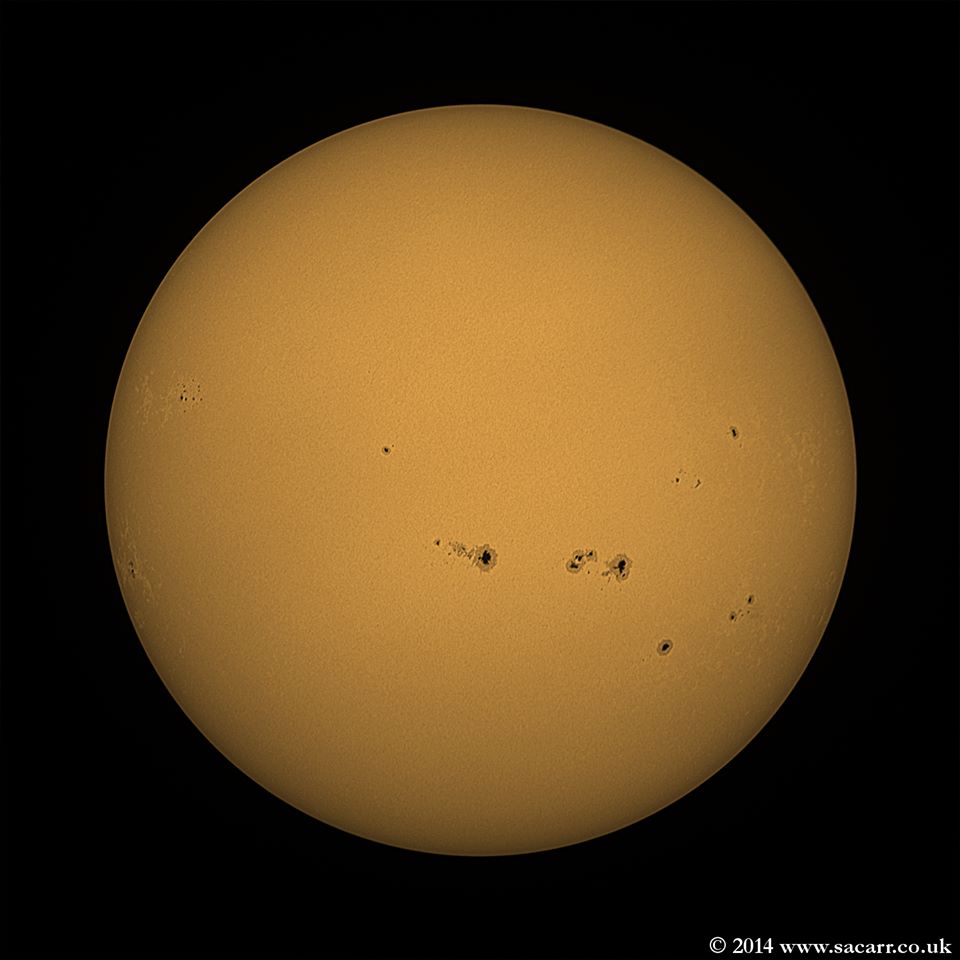
The sun has gone eerily quiet, in the middle of what should be the height of the 11-year sunspot cycle... Here's a superb photo of some sunspots that Stephen A. Carr posted to the Telescope Addicts Facebook group - a group which I follow with great interest. (Thanks for allowing
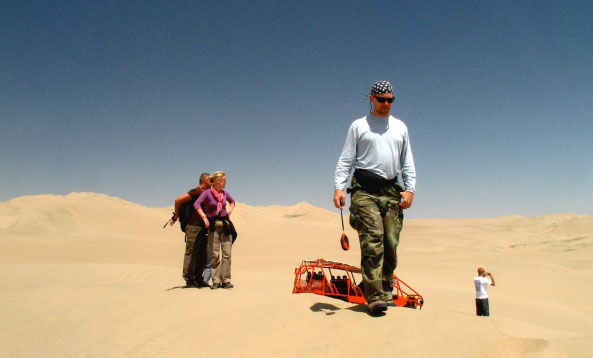
SAS is great at helping make important business decisions - how about helping decide where to take your next vacation?... Here's a picture from one of my favorite vacations with my buddy Joe. As you can see, I like "nature vacations." Can you guess where this one was? (leave a comment with
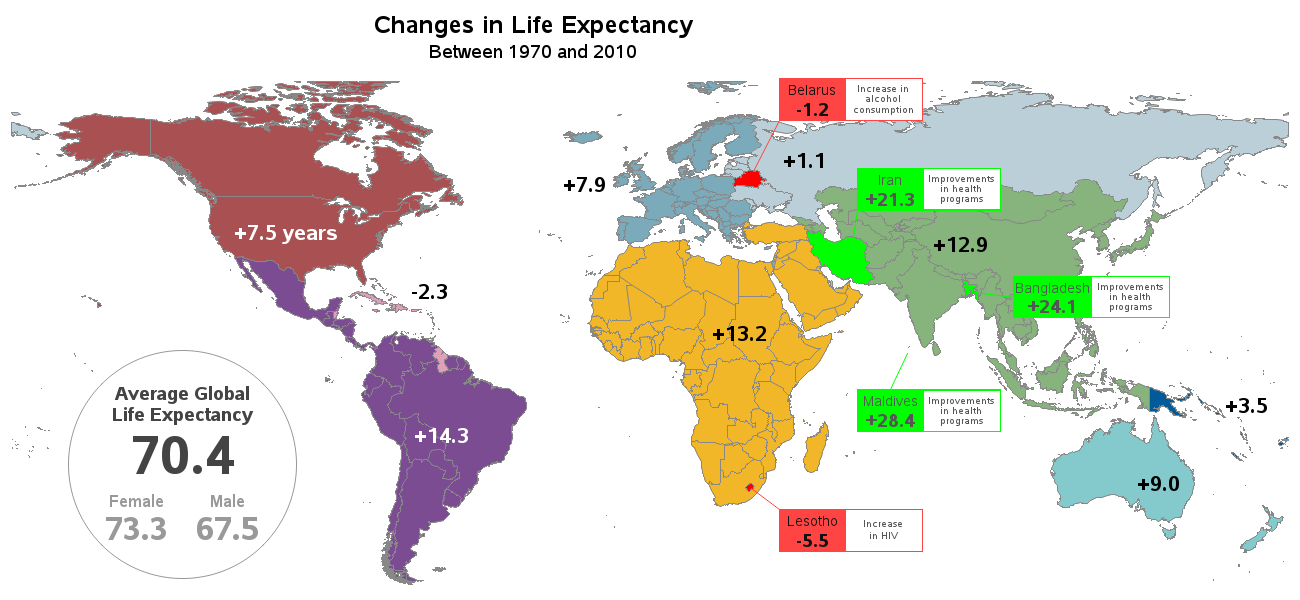
I bet a lot of SAS users know where the phrase "Live Long and Prosper" comes from ... but can we use SAS software to also help analyze 'how long'? This blog posting shows several different kinds of SAS graphs that can help answer such a question! Let's start with
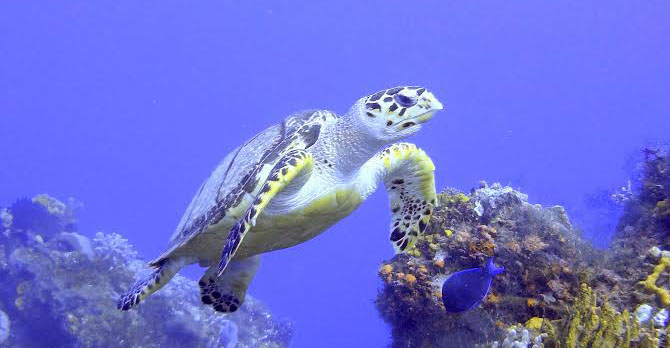
SAS software can be used for many things - here's how you could use it to help save endangered sea turtles! You've seen SAS used to track endangered wildlife by the shape of their footprints, and help run Texas Parks & Wildlife. Now, how about tracking the movements of (and thereby helping
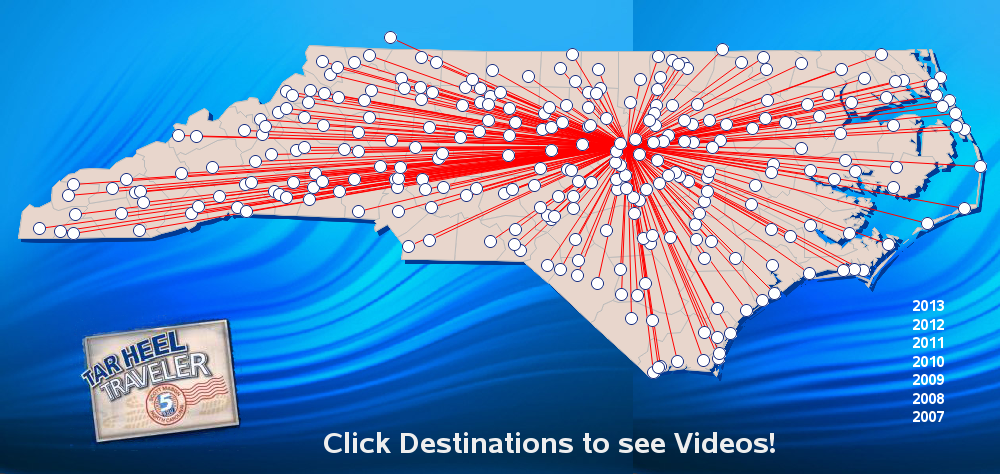
This blog post describes a neat example of some cool SAS capabilities, and also teaches you a little more about the state where SAS software is made... Here at the SAS headquarters in Cary, NC, the main TV news channel is WRAL TV5. And my favorite segment during the news is Scott
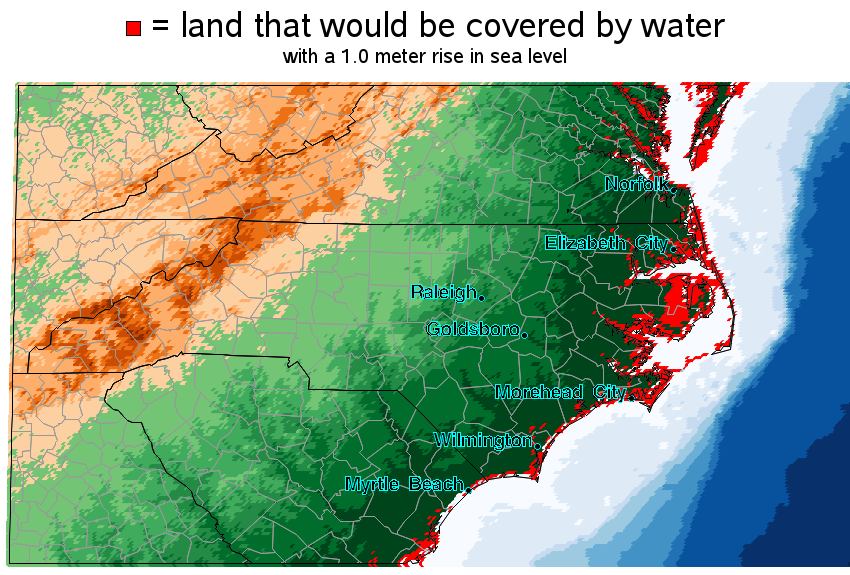
In light of the recent reports that glaciers in Antarctica are melting, what SAS graphs might be useful in analyzing the data?... When floating sea ice melts (such as at the North Pole), it doesn't raise the sea level - but when ice on land melts (such as glaciers at
All my friends seem to be having twins these days (below is a picture of my friend Holly's twins, for example) - I wondered if I could use SAS to analyze this twinning trend ... When I was growing up, way back in the day, twins seemed to be rarity.
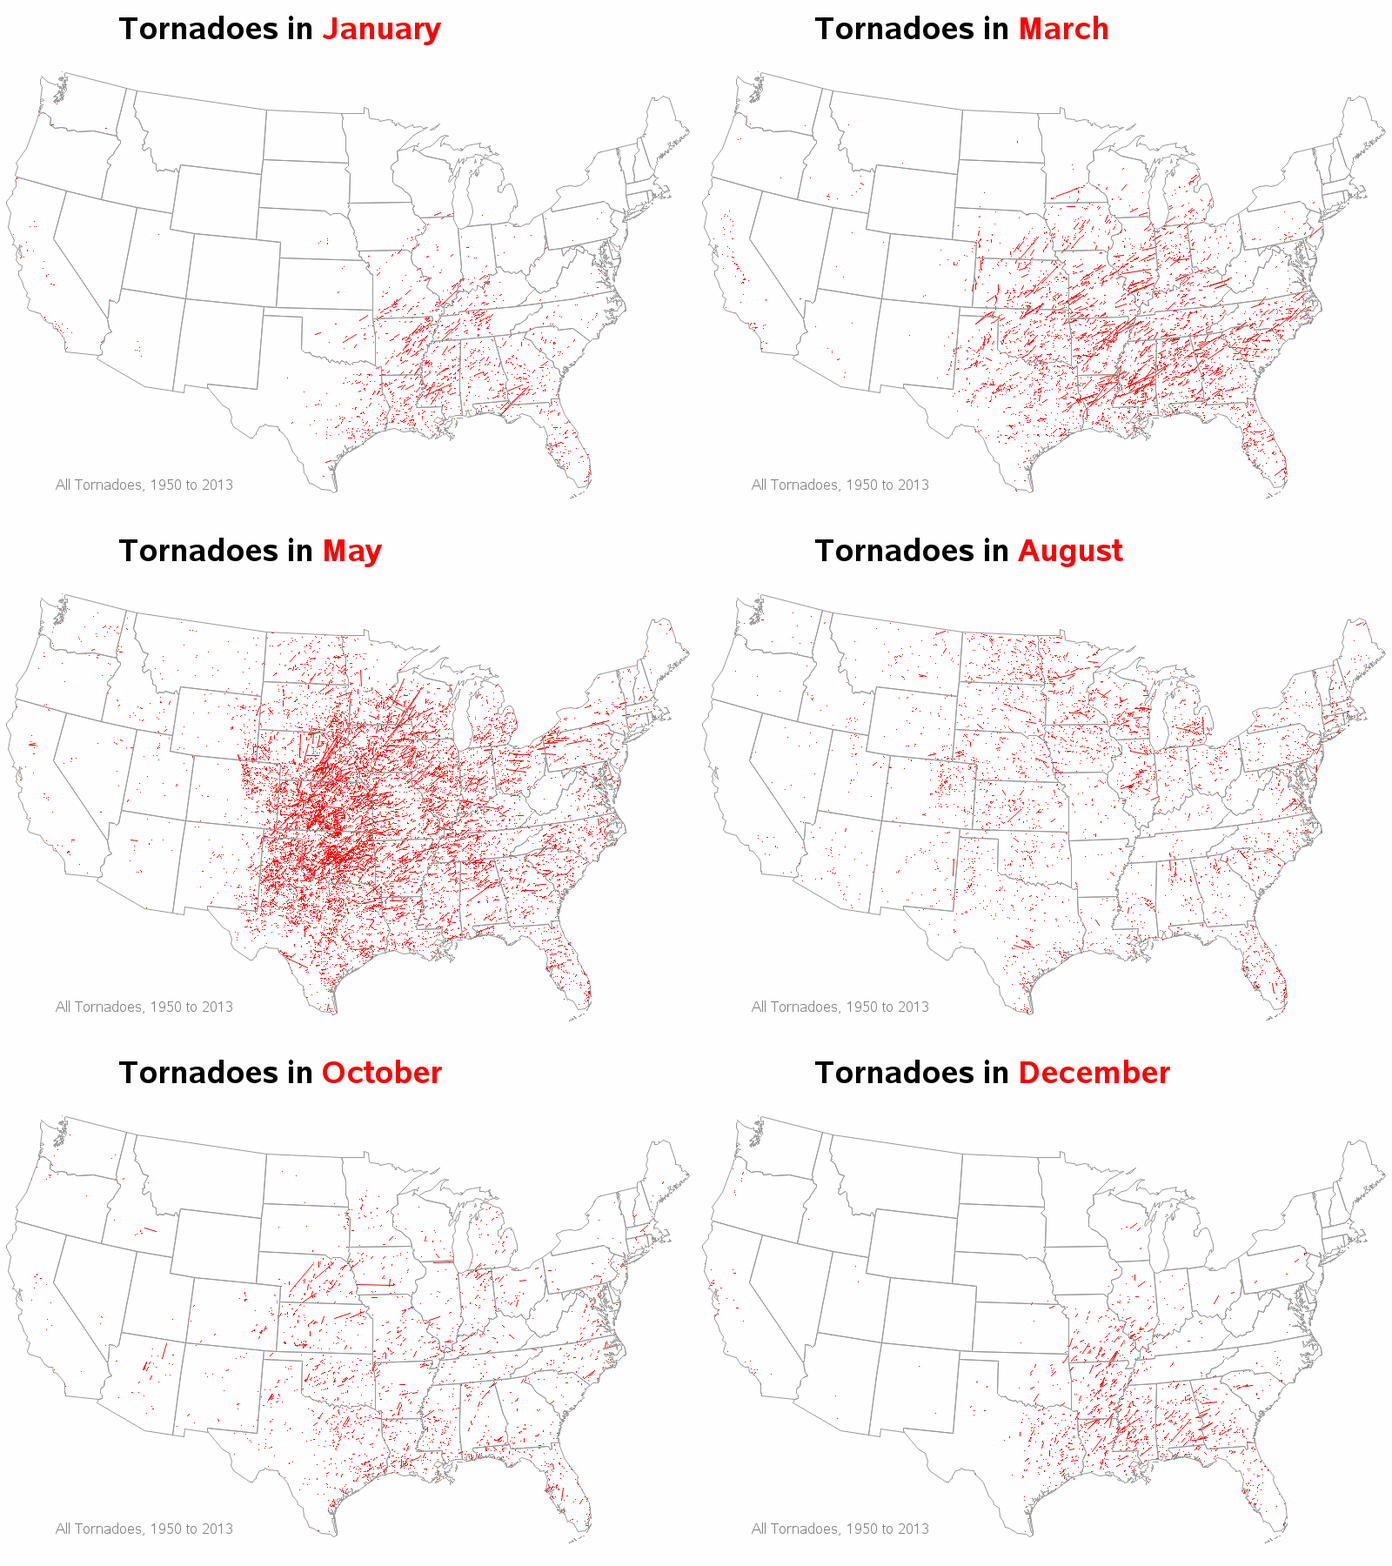
With tornadoes in the news lately, I wondered how I might could use SAS to analyze tornado data. How about animating 60 years of tornado path data? ... I was using Google to search for ways to analyze tornado data, and found an example on ustornadoes.com that animates the tornado