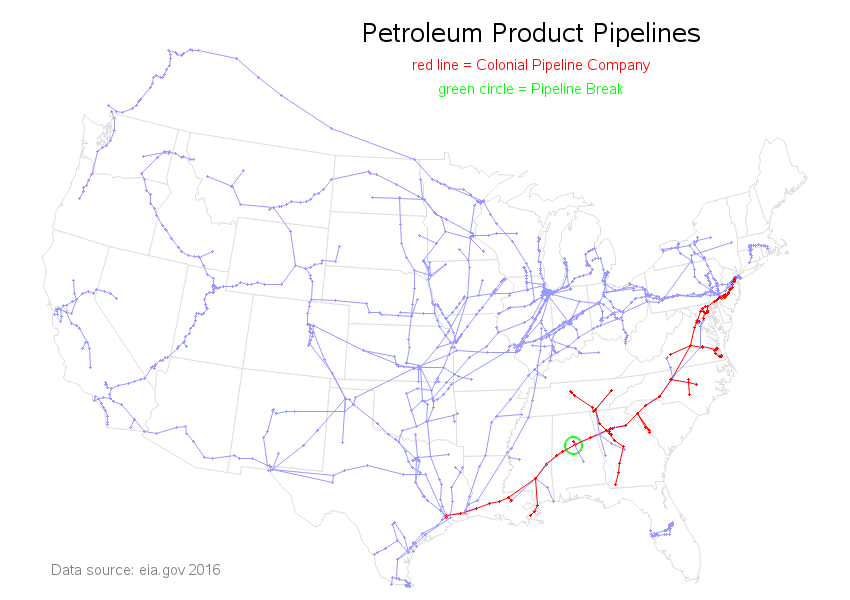
Last week, one of the major pipelines supplying gasoline to the eastern US broke. Do you know where the break is, and which states will be having shortages? Me neither! ... So, of course, I created a SAS map to help... First I read up about the spill on various
Author
I've created several hundred SAS graphs over the years. I was just musing to myself this morning how nicely Google lets me peruse through images of my graphs. And I thought some of you might also like to know how to do that... Most of you know how to search for keywords
You've seen the QR codes that you can just scan in with your smartphone's camera, rather than writing down a web URL or other information, right? But do you know how to create your own QR code? Here's an easy way to create them, using SAS... You're probably familiar with
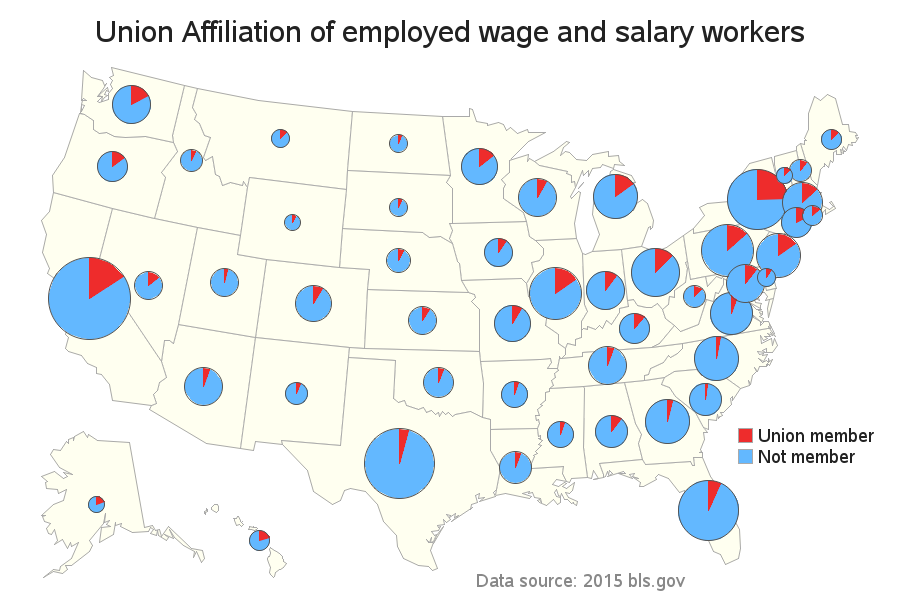
In the past, a large percentage of US workers have been union members, and the unions could exert a big influence on elections. How powerful are the unions these days, an where do they wield the most influence? Let's map it out... In 1954, almost 35% of US workers belonged to
Anybody can come up with a list of simple colors, such as red, green, and blue. If you're a bit more color savvy, you might even throw in indigo, magenta, and fuchsia. But what about more obscure names such as cornsilk, mistyrose, and midnightblue? This blog post will help you
Everyone who knows about monarch butterflies, likes monarch butterflies. This blog post focuses on their food source - milkweed. And to get you in the mood, here's an amazingly beautiful picture my friend Eniko made of a monarch: In recent years, I had heard reports of the dwindling number of
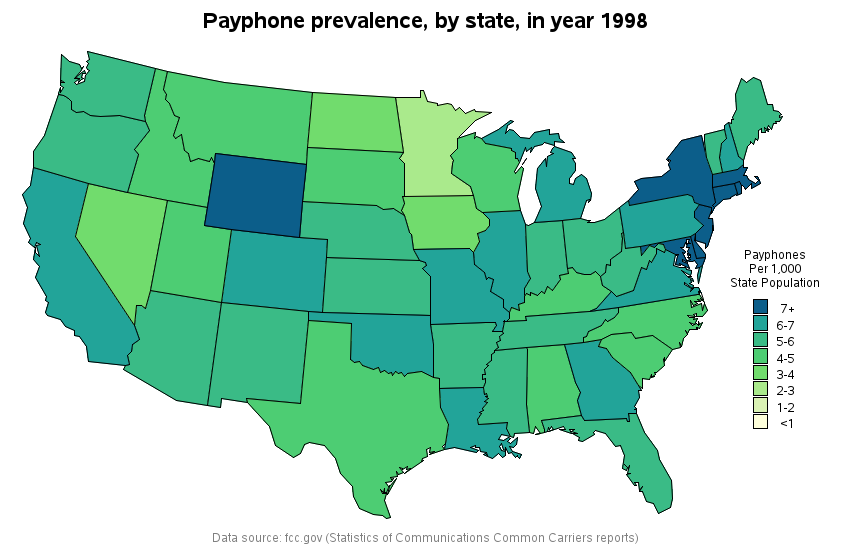
What do people have in common who have used analog clocks, vinyl records, and payphones? They were all probably born before 1980! Now, let's focus on those payphones!... A lot of young kids these days can't imagine a world where everyone doesn't have a wireless phone. My buddy Ed likes
Have you ever wondered how far you live from the closest nuclear power plant? I've crunched the numbers for cities here in the US, and created an interactive SAS map to help answer that question! The average age of US nuclear power plants is 35 years, and there just doesn't
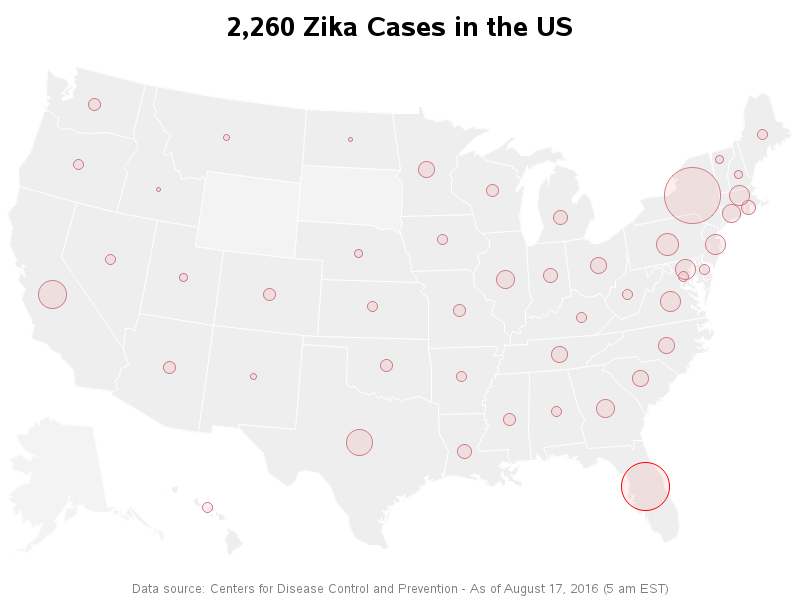
As Zika starts spreading into the US, it will be important to have a way to track it. Therefore I wrote some SAS code to pull the latest data from the CDC website, and plot it on a map... But before we get into the details of my map, I
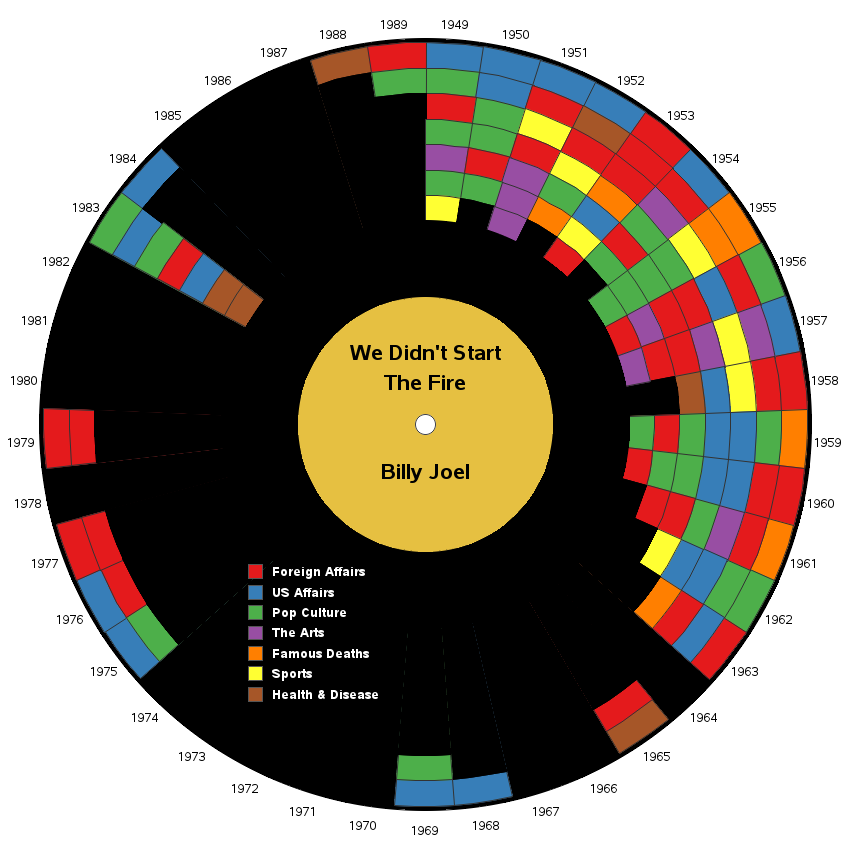
If you're into 1980s pop music, then I bet you love Billy Joel's song We Didn't Start the Fire. But do you know every word, and the significance of every reference? Let's use SAS software to create an interactive visualization that will help you fully understand this song! I first saw