The Geo Map Visualization has several built-in geographical units, including country and region names and codes, US state names and codes, and US zip codes. You can also define your own geographic units. You need longitude and latitude coordinates, which can be downloaded from many publicly available websites, including the US Census Bureau and other websites.
To create custom geographic polygons for, say, US counties, see Adding Custom Polygon Data for Geographic Maps.
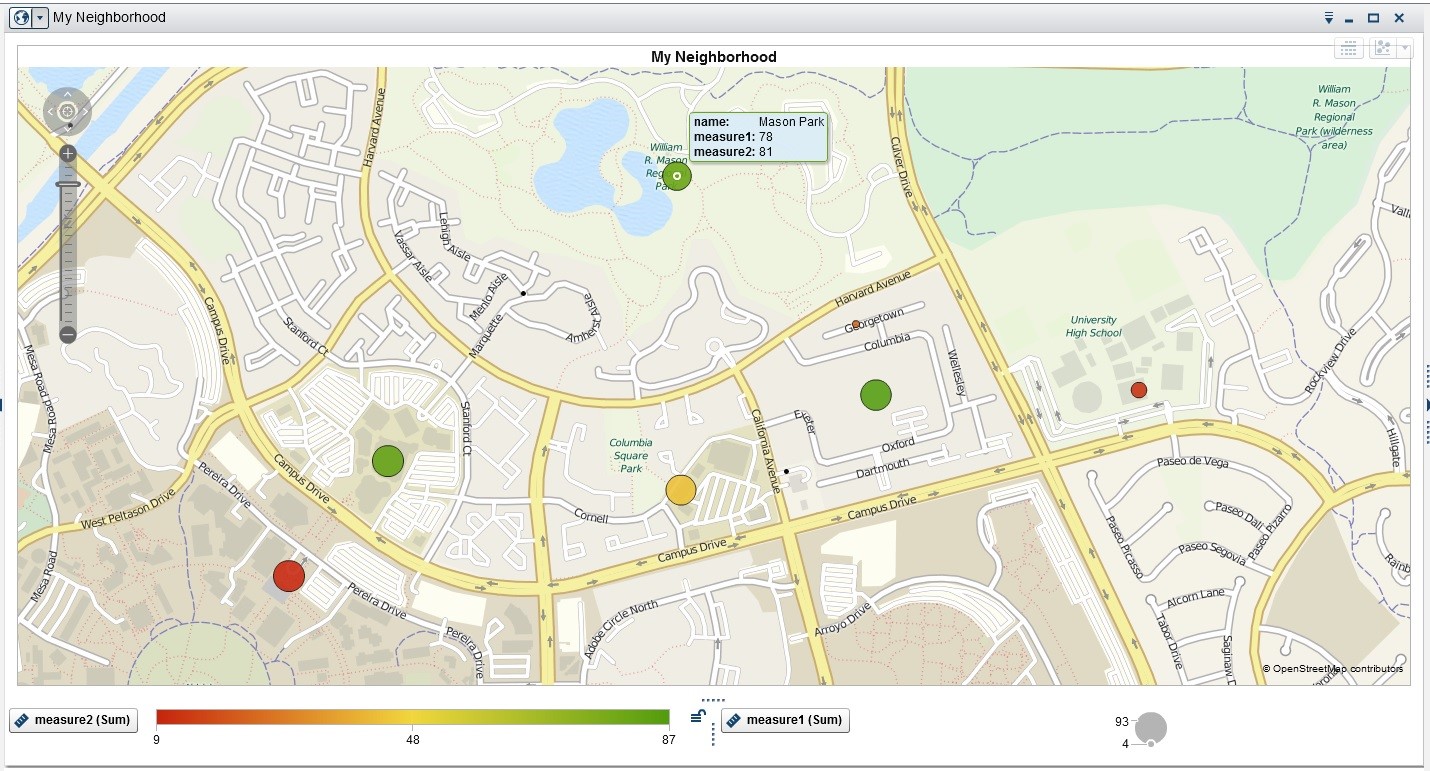
This paper describes how to identify any geographic point of interest, or collection of points, on a map. For example, I created a bubble map of my immediate neighborhood, shown below. The same techniques can be applied to any geographic area, like a park, zoo, campus, mall, housing development, sports complex, etc. Optionally, you can associate measures with each point of interest. Measures are indicated by bubble size and color, as shown below.
Begin by obtaining longitude and latitude data for your points of interest.
The http://gis.ucla.edu/apps/click2shp/ website creates a GIS file of any geographic areas, or points of interest, in the popular SHP (Esri shapefile) format. ArcGIS software is not needed.
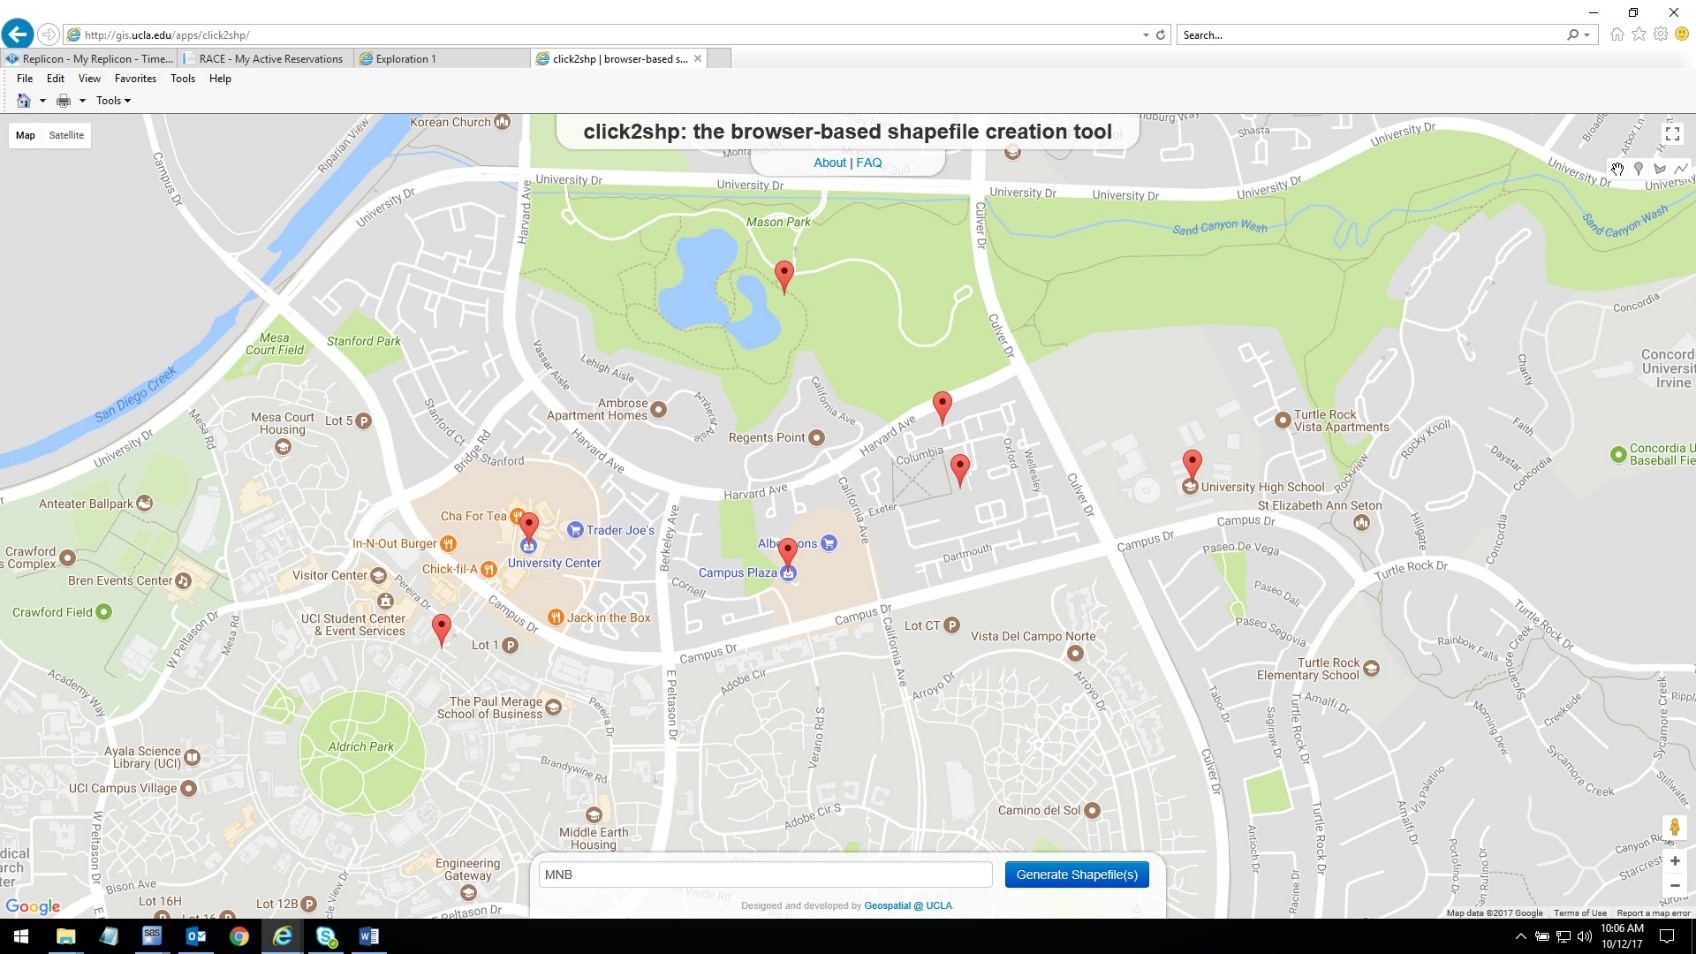
Click on the above map to select your points of interest. I selected seven points in my own neighborhood. When finished, specify a filename and click again to download the SHP file.
Use a SAS programming interface to import the SHP file to a SAS dataset:
proc mapimport datafile='C:\my neighborhood\my neighborhood_point.shp' out=mnb.mnb1; id id; run; |
PROC MAPIMPORT requires a SAS/GRAPH license.
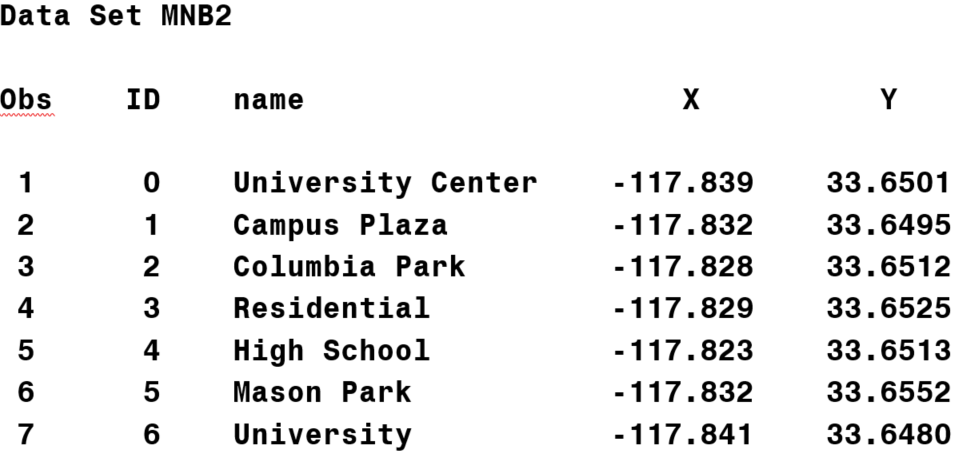
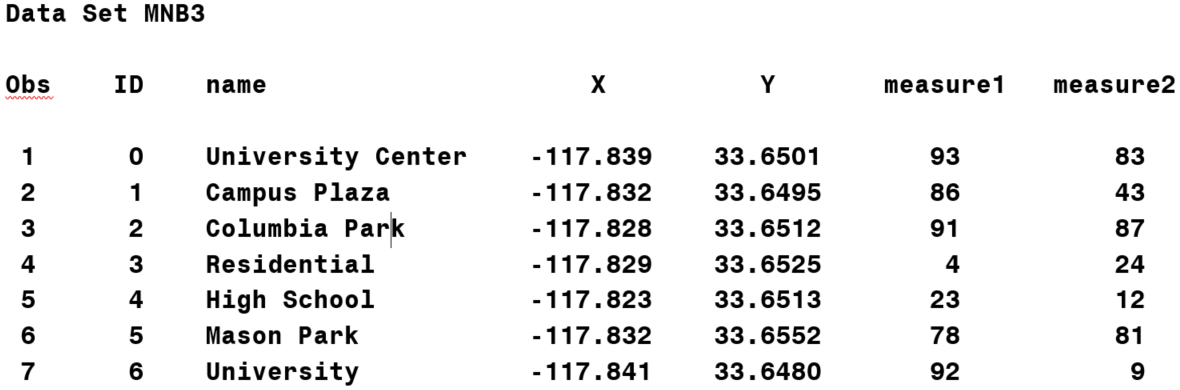
Optionally, you may create a new NAME variable to describe your points of interest.
proc format; value poi 0='University Center' 1='Campus Plaza' 2='Columbia Park' 3='Residential' 4='High School' 5='Mason Park' 6='University'; run; data mnb.mnb2; keep id name x y; set mnb.mnb1; name=put(id,poi.); run; |
Import the SAS dataset into SAS Visual Analytics.
Set the visualization type to Geo Map.
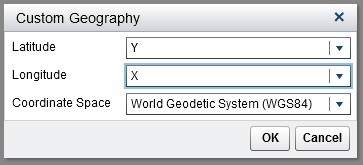
Change the classification role of the ID and/or NAME data items: Geography > Custom.
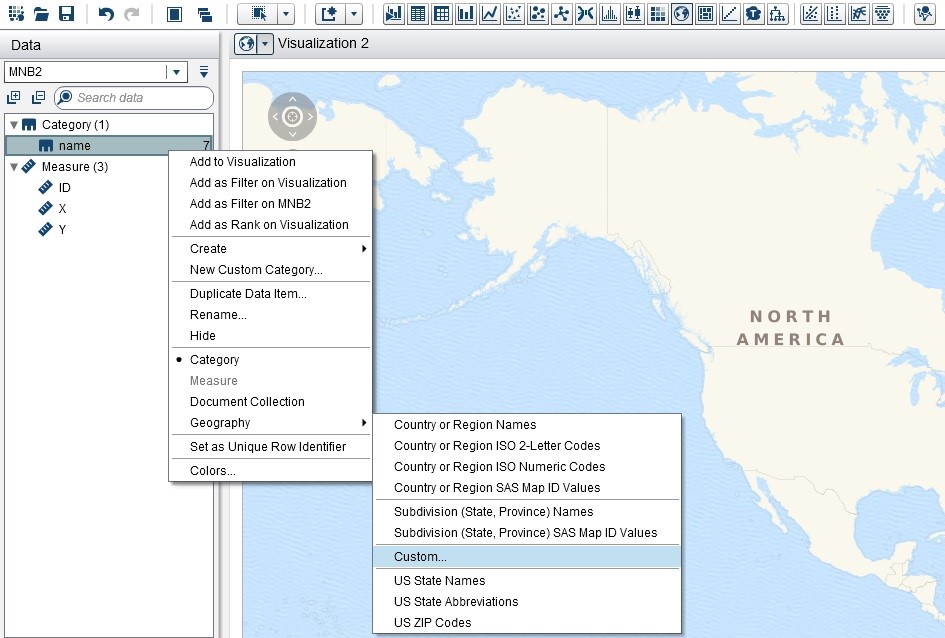
When prompted, specify the latitude and longitude data items.
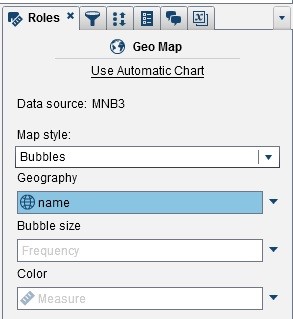
Specify a Map style of Bubbles.
Assign the NAME or ID data item to the Geography role.
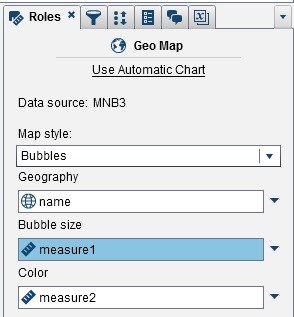
Optionally, join your geographic data with a table of measures associated with your points of interest.
Assign the measures to the Bubble size and/or Color role.
My neighborhood ...


5 Comments
Great news! As of 9.4m5, PROC MAPIMPORT is part of Base SAS. A SAS/GRAPH license is no longer required!
For the base map in SAS Visual Analytics, do we have to use Openstreetmap or an ESRI service. Or is there a way of using some other alternatives as well?
Hi Anindo,
You do not need Openstreetmap or ArcGIS (ESRI) software. All you need is a file with X/Y (longitude/latitude) coordinates.
Best,
Jim
Mr. Jim - Thanks so much for posting this and for helping us out at UAC. Hope you enjoyed your time here and it was also really nice talking to you. Take care sir.
Hey Chris,
Thanks for shout out. Great having you in class and chatting with you.
Best,
Jim