During these hot summers in the southern US, many people regard Willis Carrier (the man who invented modern air conditioning) as a saint. But along with the comfortable indoor temperatures comes the high electricity bill at the end of the month. And how much does the electricity cost? That's a difficult question - it depends on where you live. Let's analyze those differences using a map!
Recently Cristina Miguelez from HowMuch.net contacted me and said "... we've created two heat maps showing residential and commercial electricity prices. We would appreciate it if you could take a look and consider using our visual for one of your stories." How could I resist such an invitation, eh?!? Here's their map:
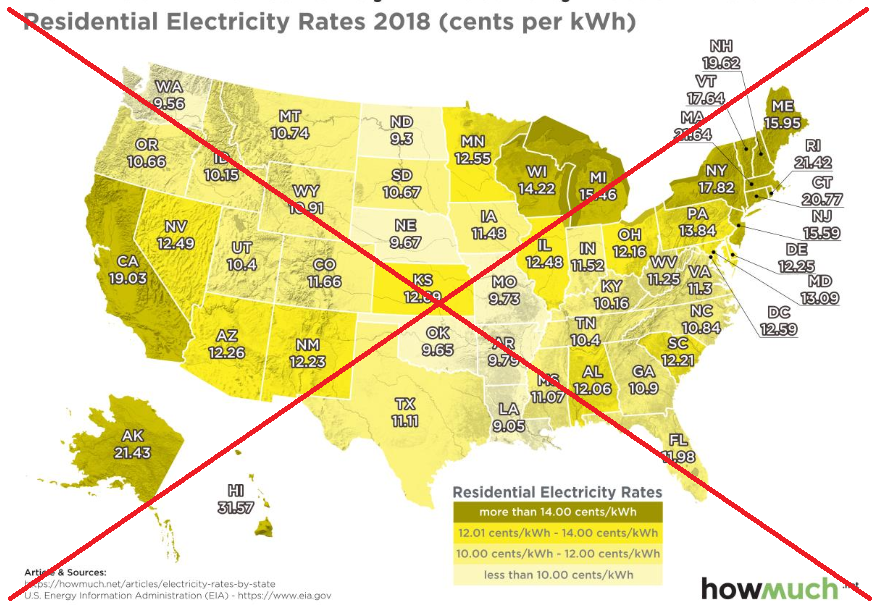
As usual, I have a few suggestions for improvements ...
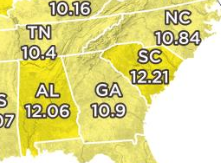
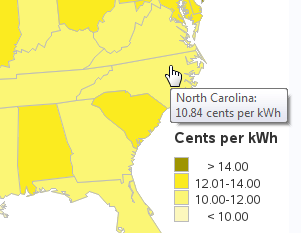
When creating a choropleth map, I suggest never using transparent colors on top of a relief map (unless it's really important to see where the mountains/etc are located). The shading of the mountains blends with the transparent color used to represent the data, and the transparent colors look darker in those locations, which can mislead the user. For example, Alabama and South Carolina have a darker shade of yellow than their neighboring states, but it's difficult to tell because the mountains make the other states look darker too:
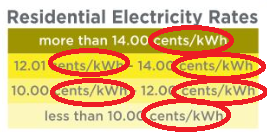
Also, there's a lot of repetition in the legend. Let me repeat that - there's a lot of repetition in the legend, there's a lot of repetition in the legend. This makes the legend more difficult and time-consuming to read than it should be.
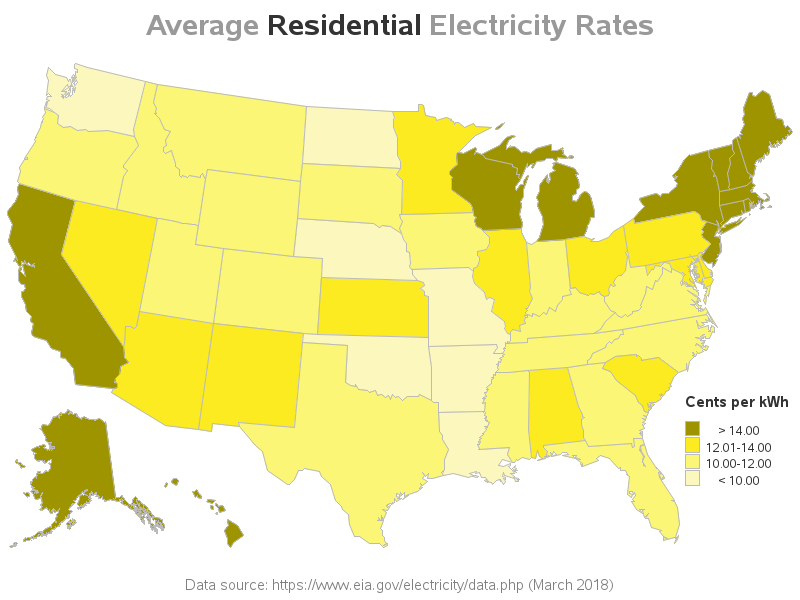
So I downloaded the Energy Information Administration data, imported it into SAS, and started working on a new/improved version of the map. Basically, I simplified it. Rather than transparent colors on a relief map, I used solid colors on a blank map. The legend only shows the ranges of values for each color, and the 'Cents per kWh' is only shown once in the legend label. I emphasized the word 'Residential' in the title, so you can quickly tell that's what this map is about (there is a second map for the Commercial rates).
You might notice that I left out the labels on the map. In their place, I added HTML mouse-over text. Click the map above to see the interactive version with the mouse-overs. I think this reduces clutter on the map, and makes it easier to view. Here's a screen-capture of what the mouse-over text looks like:
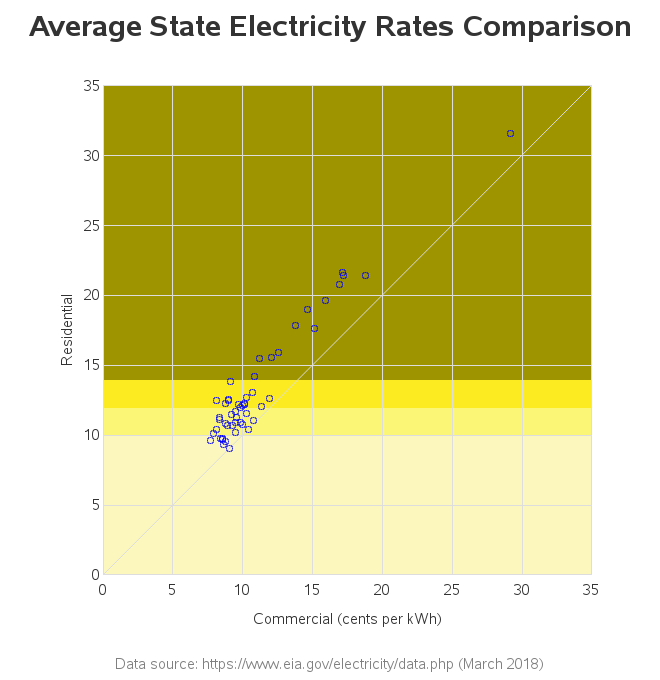
The HowMuch article has a second map (of Commercial rates), and mentions some comparisons between the Residential and Commercial rates. But the maps do not really lend themselves to such a comparison. Seems like a scatter plot would make that comparison much easier, so I created a scatter plot (and added color ranges to correspond to the colors in the map). The diagonal line shows where Residential and Commercial rates are equal - the farther a state is from that line, the more difference in the rates.
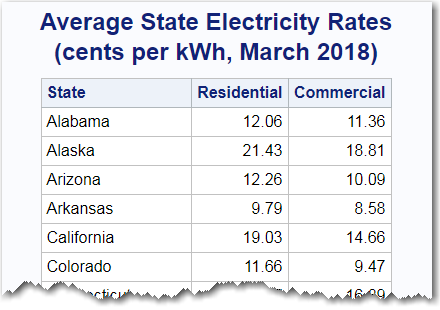
And, I followed the map and plot with a table of the data. That way, if you want to find the values for a certain state, that's easy to do. Here's a screen-capture of a portion of the table (click the screen-capture to see the full table):
Is the electricity in your state cheap, or expensive? And my international readers - how do US electricity prices compare to the prices in your country? Who has some cool tips & tricks for reducing your electricity consumption (and thereby reducing your monthly bill)? Feel free to discuss in the comments section!


2 Comments
Great read and nice map redo Robert!! You made it much easier on the eyes.
I am from the Bahamas where the average cent per kWh is 22.0. Which is double what we pay here in NC.
Thanks! - That means a lot coming from a visualization expert like you!
And somehow, sometimes, I think it might be worth paying double for electricity, to be using it in the Bahamas! ;)