With Hurricane Irma recently pummeling pretty much the entire state of Florida, I got to wondering where past hurricanes have hit the state. Let's get some data, and figure out how to best analyze it using SAS software!
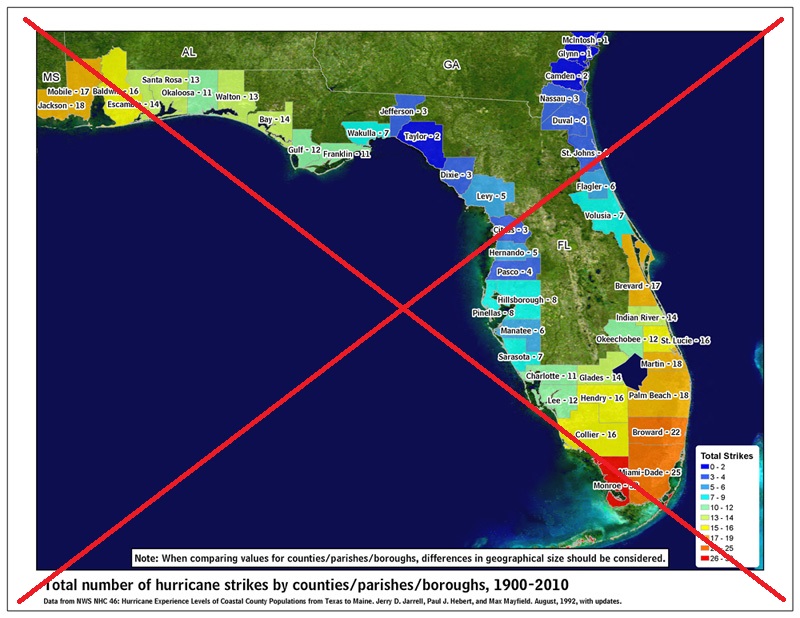
I did a bit of web searching, and found the following map (on NOAA's National Hurricane Center website) that seems to a answer my question. It looks like the southern & southeastern tip of Florida get the most hurricane strikes, and the middle-western edge get way fewer strikes. I would guess this is probably caused by the direction hurricanes typically approach from.
But the more I looked at their map, the more things I noticed I wanted to change. For example:
- The county names & totals were difficult to read.
- The ocean color(s) were the same as some of the legend colors, which could cause visual confusion.
- The title text & legend were wedged in at the bottom of the map, not taking advantage of the free ocean space.
- The satellite map didn't seem to add much value.
- The maximum legend values were at the bottom (rather than top of the legend).
- And, there was no indication of where the major cities were located.
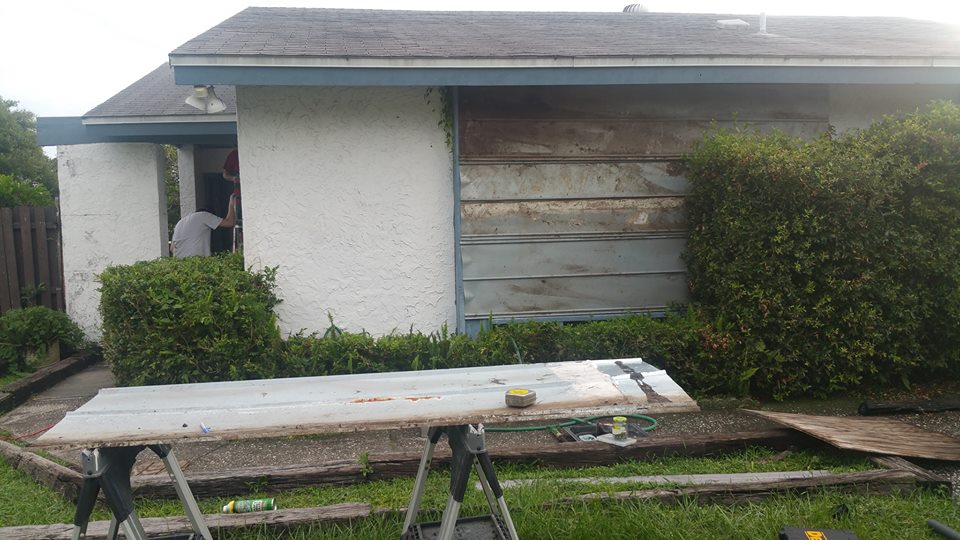
Speaking of major cities, and the rarity of hurricane strikes along the middle west coast of Florida, here's a picture from my friend Traci, who lives in Tampa. They seldom have to worry about a strong hurricane strike in Tampa, but for Irma she boarded up her house, and stayed the night in a very strong structure instead. (Fortunately her house came through the hurricane just fine!)
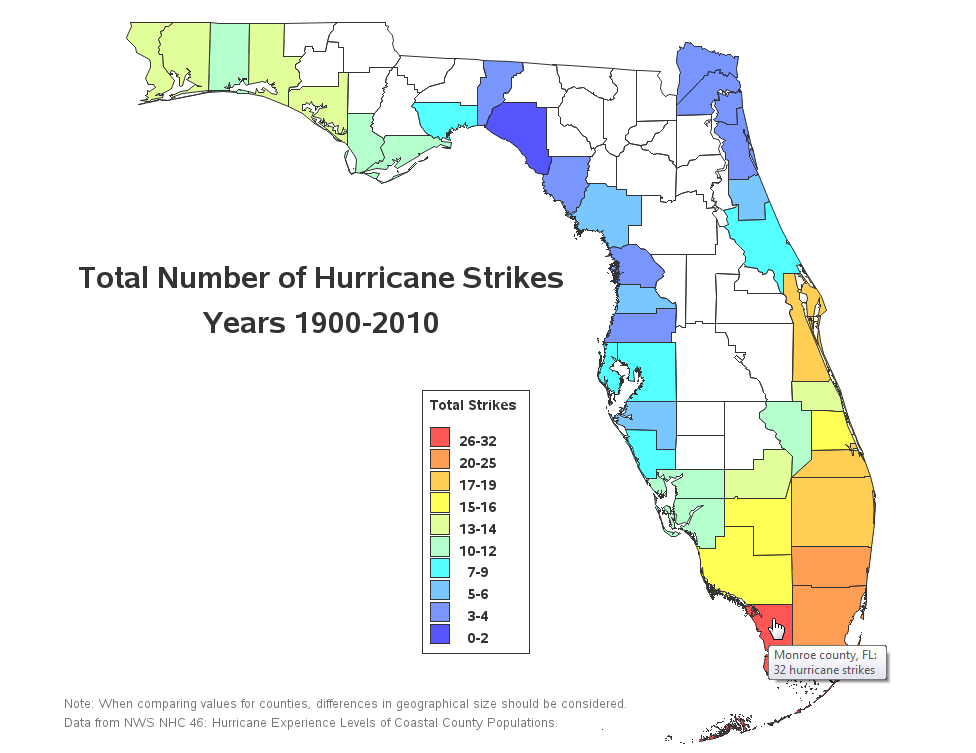
And now, back to the data analysis! I manually typed all the county names and numbers from the map (above) into a SAS dataset, and started my visualization journey by just plotting a simple Florida county map. I shaded it like theirs, but sorted my legend so the maximum numbers were at the top (which seemed more intuitive). I placed the title text, and the legend, in the Gulf, since there was plenty of unused space there. And rather than trying to fit labels for each county, I placed the info in HTML mouse-over text (click the image below to see the interactive version). The mouse-over text makes it easier to read the text ... and the screen-reading software for the blind can also read it that way!
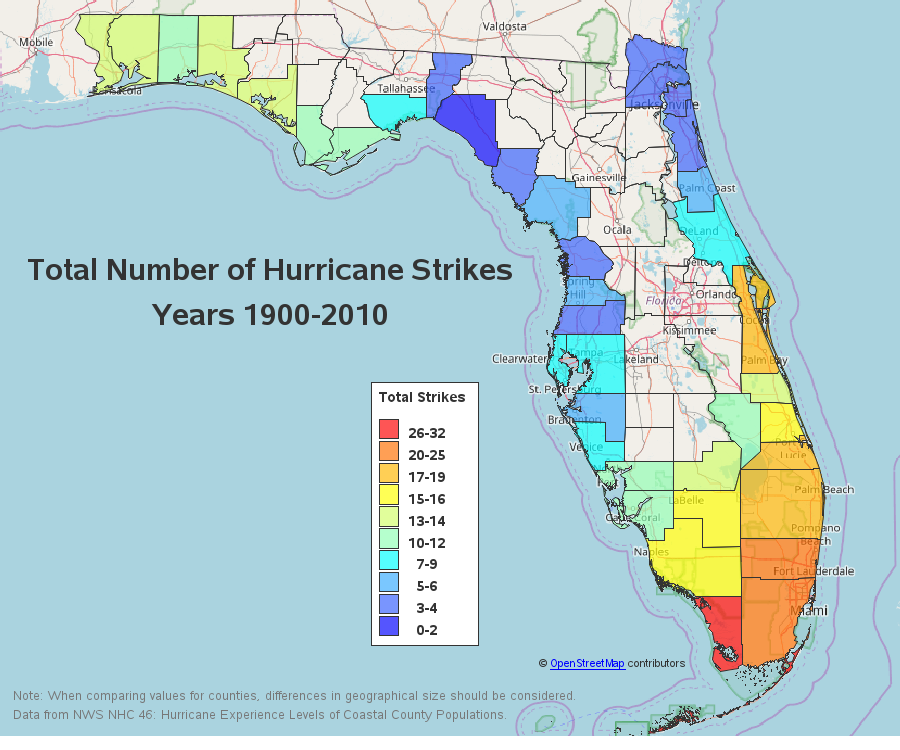
I actually kinda like the simple version of the map (above), but I decided to try also adding an image map behind it, to be similar to the original. But rather than using the satellite image which mostly just showed green trees & blue water, I used a streetmap which shows roads & cities. I also made my county colors transparent, so you can see the roads & cities behind them. I'm not sure which of my two maps I prefer - the plain one, or the one with the streetmap ... but I always say it's useful to look at the same data in several ways, therefore let's keep them both!
Now that Hurricane Irma is pretty much behind us, do you have any stories about how you weathered the storm? Feel free to share in the comments section!
110 years of hurricane strikes in Florida! Click To Tweet


6 Comments
I'm a little confused about the white counties. Almost all inland counties are white, but a few show hurricane strikes. My first thought was the data is based on where landfall took place, except those several southern counties. Is it just that blank counties have no data from the source? Fantastic map, it makes me more curious about where and why the hurricanes go
Good question. The original map where I got the data was labeled "coastal counties", and I assume they're counting counties along the large Lake Okeechobee as 'coastal' (but I'm not 100% sure).
Can you do this for Texas?
Nice choropleth map! I live in Gainesville, which as you can see (on your 2nd map) is situated well inland. We experienced minimal hurricane force winds if not simply tropical storm force winds - but we also received 12" of rain in about 18 hours. This is a city in a dense urban forest, and many large trees (especially loblolly pines) came down taking out power and communication lines. Some homes in low lying or poorly drained areas flooded. I've been here 60 years, and have not witnessed this level of destruction before... even when a tornado went through town! But what we experienced here pales in comparison to what happened to the Keys and SW Florida!
Interesting details! (Maybe I should also create a rainfall map for Irma, like this one I created a few years ago for Fran: http://robslink.com/SAS/democd1/fran.htm)
Rainfall totals for Irma would be interesting... What also could be revealing is to determine if hurricanes are indeed dumping relatively more rain nowadays than in the past...
Another interesting analysis would be to see if size of the cyclones has been increasing.