How bad was the recent recession on the Las Vegas housing market, and what lingering side effects are still being felt? If you don't know squat about real estate housing markets, then this blog post is for you! It takes a simple graphical look at some data that helps explain the basics ...
I recently read an interesting article in our local news about a real estate scam. Apparently someone had surreptitiously gotten access to a vacant house, and listed it for sale on Craigslist. The new 'owner' paid a $3,000 deposit, and was unpleasantly surprised when the police showed up and told him he was trespassing and had to leave. This got me wondering about all those foreclosed houses that are still vacant in the aftermath of the housing bubble and recent recession. I did a few Web searches on the topic, and found that this is an especially big issue for Las Vegas right now.
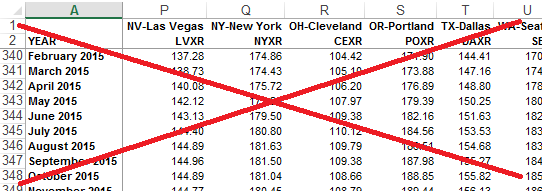
I wondered how much of a drop the Las Vegas housing market had experienced (compared to other big cities), so I located the historical home price index data and downloaded the spreadsheet. It was good to have my hands on the data, but I found it a bit difficult to get a good mental picture of it, just by looking at hundreds of numbers...
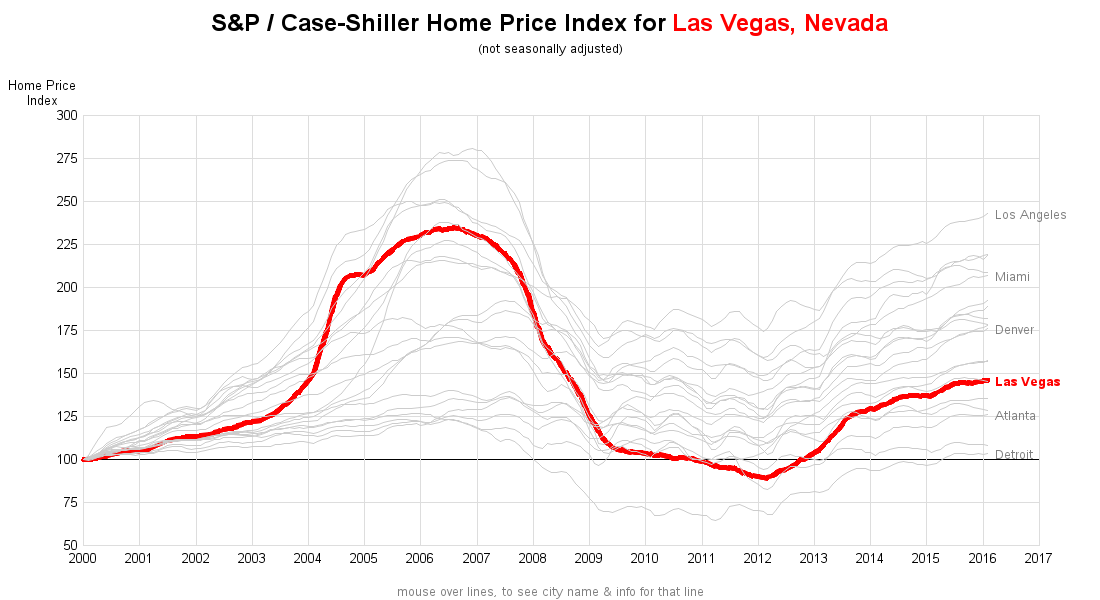
So I imported the data into SAS, and plotted it all, with Las Vegas in bright red (so it stands out). Looks like back in 2006, Las Vegas' housing market was one of the hottest, and it was also one of those that fell the lowest in 2012. Click the image below to see the interactive version, where you can hover over each line to see all the city names and monthly values.
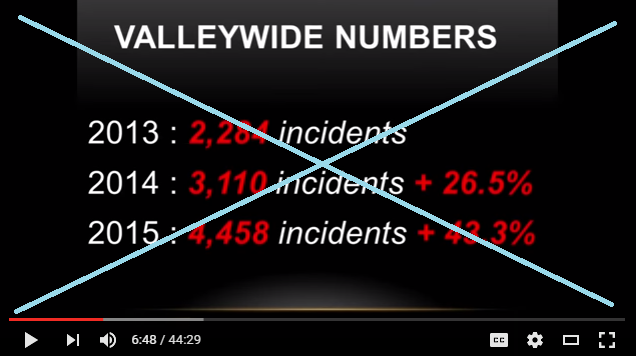
I suspect that people trying to sell a vacant home they don't really own (like the Craigslist scammer) is fairly rare. But people squatting in a vacant home, on the other hand, is much more common. It's such a big problem that they even came up with a new law to help the owners throw out squatters. I did a little searching and found some quantitative numbers in a YouTube video (see screen capture below):
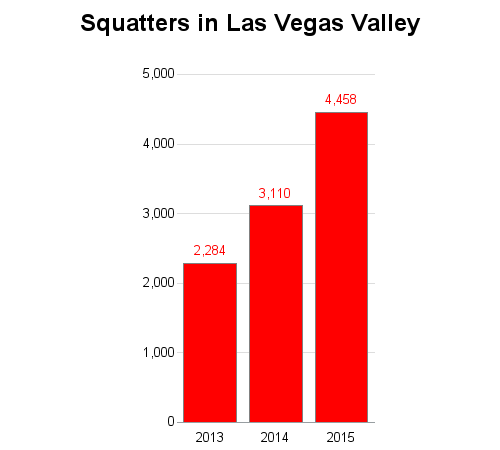
The numbers in the video seemed impressive, but I had to study the text too long to get a handle on the data (were the % numbers compared to the previous year, or the first year?). I thought it would be much easier to visually compare and analyze the numbers using a bar chart - so I cranked up SAS again and created the following chart:
What's the housing market like in your area right now? When the bubble burst, was it a bad or good for you? Are there still a lot of vacant foreclosures in your neighborhood? If you have an interesting story related to this topic, feel free to share it in a comment!
