In this blog post I explore some of the open data police incident reports for Raleigh and Cary, while showing you the easy way to handle various types of CSV files.
In recent years, many cities have set up open data websites, to share various kinds of data about their city. I decided to download the Raleigh and Cary police incident reports, and set up some examples that might be a good starting point for others wishing to analyze the open data for their city.
I found the Raleigh, NC open data page for their police incidents, clicked the 'Export' button and downloaded the CSV file. Their data is stored in a very simple/traditional comma-separated-value format, and I was therefore able to use SAS' Proc Import with the traditional dbms=csv:
PROC IMPORT OUT=raleigh_data DATAFILE="Police_Incident_Data_from_Jan_1_2005_-_Master_File.csv" DBMS=CSV REPLACE; GETNAMES=YES; DATAROW=2; guessingrows=MAX; run; |
Here's what the imported data looks like:
Similarly, I found the Cary, NC page, and downloaded their data in the csv format. I naively tried the traditional SAS code to import the csv:
PROC IMPORT OUT=cary_data DATAFILE="cpd-incidents.csv" DBMS=CSV REPLACE; GETNAMES=YES; DATAROW=2; guessingrows=max; run; |
But the data came out in (mainly) two big character variables, with multiple fields all globbed together.
Upon further investigation of the cpd-incidents.csv file, I found that the values were separated by semicolons rather than commas. And I thought to myself, "That's not a comma separated value file - what have these people been drinking!?!" But upon further investigation of the definition of a csv file, I found that it has "records divided into fields separated by delimiters (typically a single reserved character such as comma, semicolon, or tab; sometimes the delimiter may include optional spaces)." I guess a semicolon is actually fair game ... so I put on my big-boy pants, and used some slightly different Proc Import code, that allows me to specify the delimiter:
PROC IMPORT OUT=cary_data DATAFILE="cpd-incidents.csv" DBMS=DLM REPLACE; GETNAMES=YES; DATAROW=2; guessingrows=max; delimiter=';'; run; |
And now the data imports much more cleanly, with each field in a separate variable. Here are a few of the many variables in the data:
You might be asking why I didn't write my own code to read in the data via a filename and a data step? Well, in order to do that, you must determine an appropriate informat to read in each delimited field, and you must hard-code the order of the variables - and if they ever change something in the data file (formats, order of variables, add a variable, etc) then the code where you hard-coded all of those things will no longer work. Using Proc Import will hopefully insulate you from most problems like that.
Now that we've got the data into SAS, what should we do with it? Well, first I did a lot of "looking at" the data, using simple plots, frequency count of unique values, etc. I found that the data is not 100% consistent from year to year - for example, the text descriptions changed over the years, and it appears that for some offenses some of the data might have been tracked in other systems for some of the years. But even with those limitations, I thought it would be fun & interesting to do a few plots of the Driving While Impaired (DWI) data ... since I had accused the people who created the csv file of being drunk a few minutes ago, LOL.
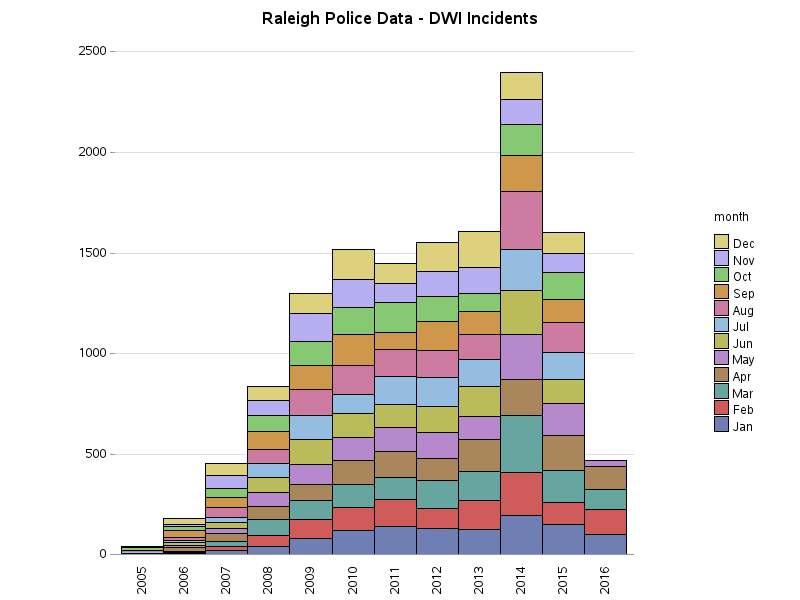
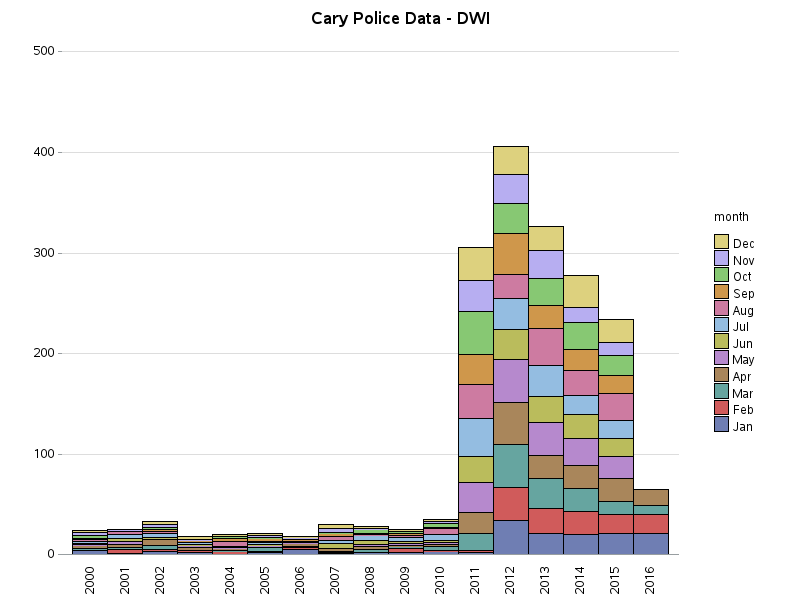
Here's the number of DWI incidents (tracked in the data) for Raleigh & Cary, plotted by year and colored by month. There is a definite spike in Raleigh for the year 2014, which was the result of a special DWI Task Force that year. I'm still waiting for an official reply, but the lower values in the early years of data might be because most DWI incidents were tracked in another system during those years. It's not perfect data, but still interesting!
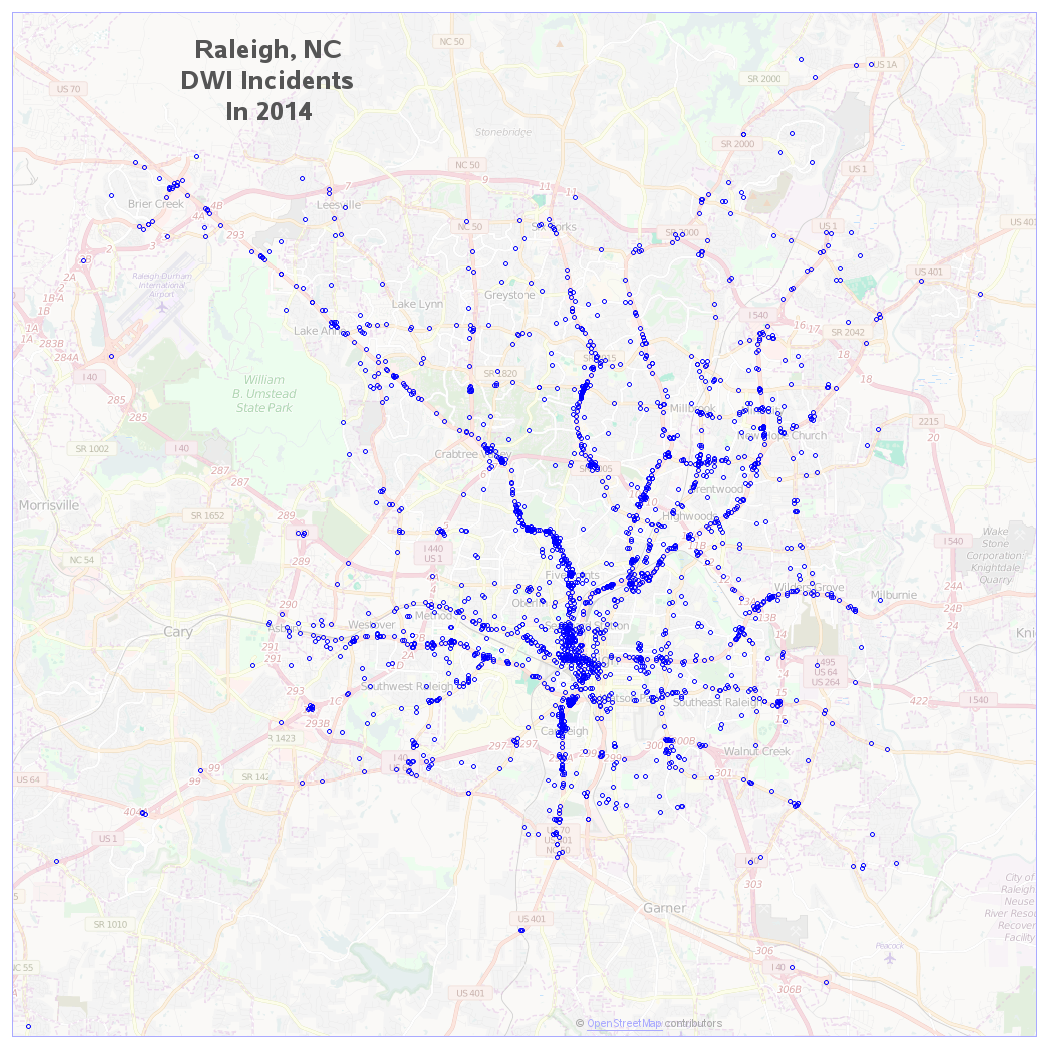
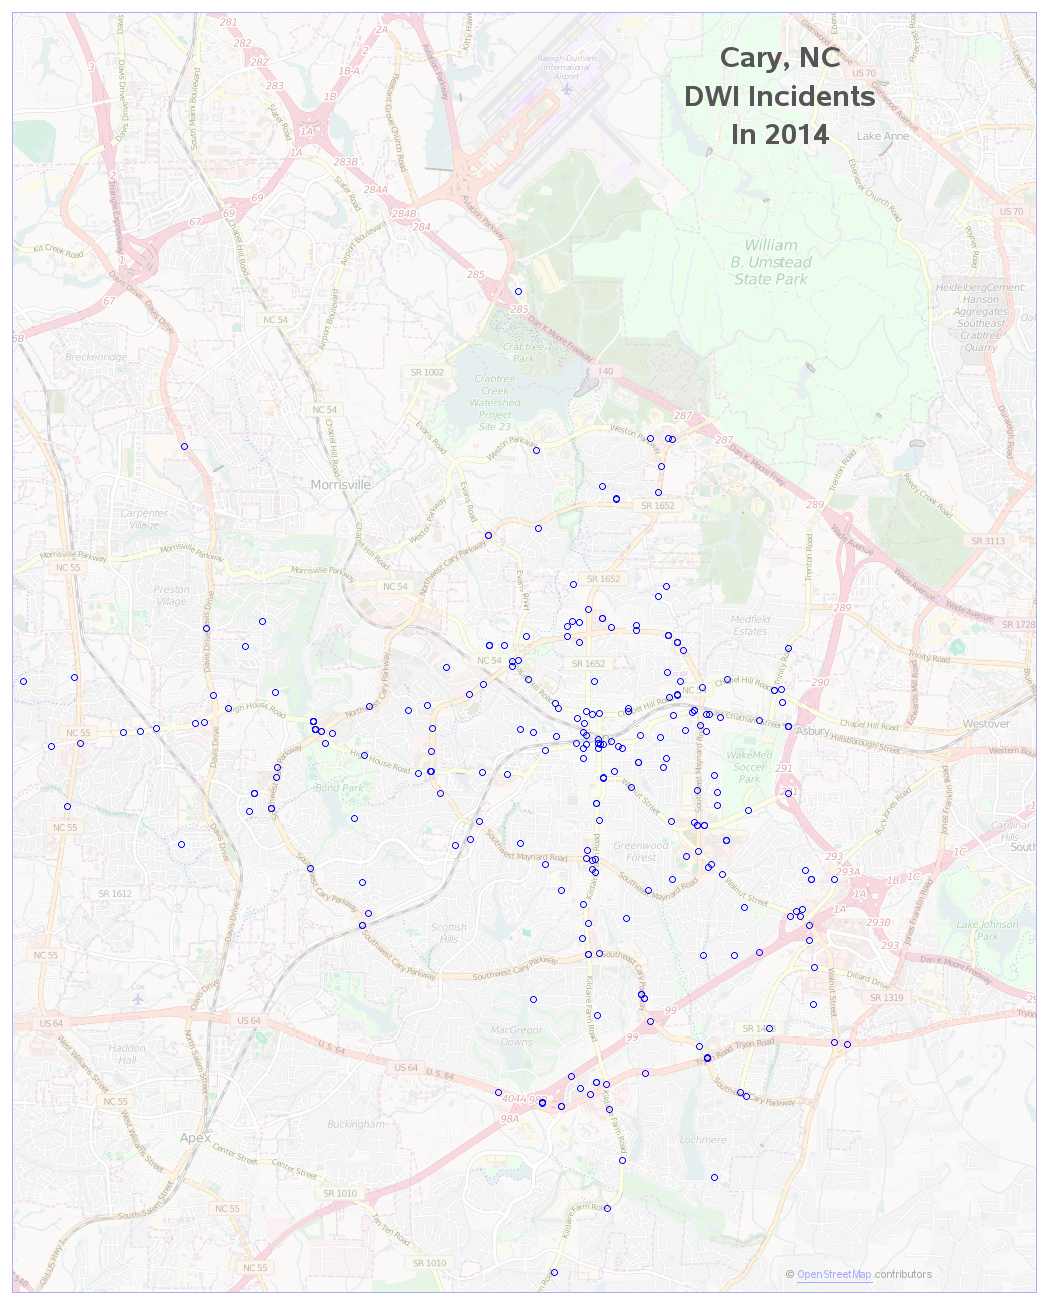
The data also has lat/long coordinates, so I thought it would be interesting to plot it on a map. Since I'm familiar with Raleigh & Cary, I can visually check whether there are more DWIs around the bars, and the areas where I've seen sobriety checkpoints in the past. Looking at the maps, there are definitely some trends and stories in this data. I'm including the 2014 maps below, and you can click these Raleigh and Cary links to see all the DWI graphs and maps. Note that the Cary map is zoomed-in more than the Raleigh map, since Cary is a smaller city.
If you'd like to see similar graphs and maps for Motor Vehicle Theft, here are links for my Raleigh and Cary pages showing that data. With these maps, I know which areas not to leave my car parked in! :-)
What other kinds of analytics would you like to perform on the open data Raleigh and Cary have provided? And what other variables or details would you like added to the data, so you can perform even more interesting and useful analyses? (feel free to leave a comment with your ideas!)


6 Comments
Just for the record: no drinking is involved. Semicolon is the standard delimiter of a csv file in Europe - actually in any location where comma is a very bad idea.
The explanation, I guess, is that we use comma as the decimal point... So no numbers can be held in a csv file, unless either the delimiter is changed, or the delimiter is enclosed by other characters (which is just as ugly and takes up space).
Obviously we have adjusted to the fact that you can't trust a name.. The Americans (or rather: English speakers) got to name stuff in the morning of the digital age - but we don’t change the grammar of our languages just to fit with commonly accepted names of things. ☺
Nice explanation - thanks!
If you want a CSV challenge, try the Donors Choose data. They use \ for escaping quotes, commas and embedded line breaks. And the first line seems to be missing its line break. And the essays data is 3GB.
Using \ to escape special characters is characteristic of unix. It leads to very fast parsing with simple regular expressions. The BASIC-derived method of using enclosing quotes around text and to hide separators is much more difficult to parse efficiently. For one, you also have to escape the quoting character, so the problem of special characters is not solved, only made more complex. The choice of doubling the quote character is also not ideal.
An efficient way to deal with your \-escaped data might be to parse it with the unix awk program first and output something simple that SAS can read, such as tab-separated.
This is a great way to start investigating data. Do you have the code that generated the charts and maps? I would find them of great interest also.
Here are links to the SAS code for Raleigh:
http://robslink.com/SAS/democd86/raleigh_crime_info.htm
And for Cary:
http://robslink.com/SAS/democd86/cary_crime_info.htm