How does Santa keep track of everything on his big night? I can't confirm or deny that he uses SAS software -- but if he does, it would look a lot like this! ...
A couple of years ago, I blogged about a prototype dashboard that I wrote for Santa. This year, I've enhanced the dashboard to include some recently-added SAS animation functionality. Now there is an "Animate!" button on the map pane of the dashboard, and when you click it you'll see Santa's secret sleigh route through that continent animated. Click the image below to try out the dashboard, and see the animations:
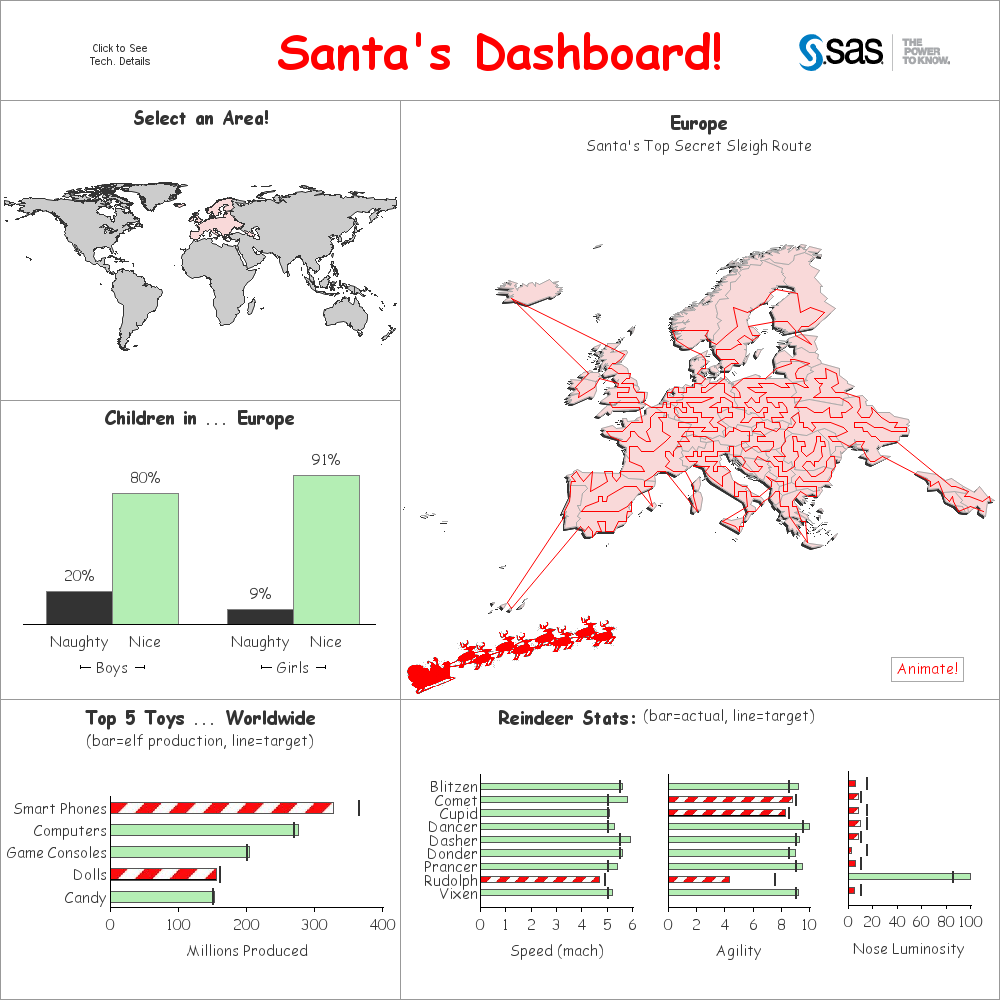
When you're viewing the dashboard, click a continent in the upper/left map, and you'll see that continent's route in the large (top/right) map pane. You can hover your mouse over the map areas to see the country names, and click on them to launch a Google search for Christmas traditions in that country. The naughty/nice bar chart is also updated for each continent. And don't forget to scroll down to the reindeer stats in the bottom/right, to see whether the reindeer have met their target in several performance categories.
Feel free to share this dashboard with all the little kids you know ... and even the big kids you think might enjoy it!


5 Comments
Great post as always Robert!
By the way, I can confirm that Santa is in fact using SAS software:
Santa's Gift Assignment Problem.
I really enjoyed this. So amazing!
Robert,
Very, deeply amusing as well as informative! So, that's how Santa does it:-)!
Best wishes to you and your many readers for a happy holiday season!
----MMMMIIIIKKKKEEEE
(aka Michael A. Raithel)
Thanks Mike - happy holidays to you as well!
Love the Nose Luminosity metric :-)
Thought your readers might like this video on the mathematics of how fast Santa has to travel on Christmas Eve,,, https://www.youtube.com/watch?v=7t4x_wHROFQ