
The ancients’ practice of publicizing set-in-stone personal records would run anathema to modern data privacy laws.
These days, in lieu of using contemporary personally identifiable records, I anonymized a 4,000-year-old tax record from ancient Babylon to describe three principles for effective data anonymization at scale:
- Embracing rare attributes: values and preserves unique data points for insights.
- Combining statistics and machine learning: enhances accuracy and effectiveness of data analysis and anonymization.
- Stewarding anonymization fidelity: ensures the quality and integrity of anonymized data, preventing re-identification.
Data openness, efficiency and privacy protection
Modern governments make tradeoffs between data openness, efficiency and privacy protections. In carving a path for data governance, state-mandated privacy protections, like the EU General Data Protection Regulation (GDPR), China's Personal Information Protection Law (PIPL) and the California Consumer Privacy Act (CCPA), introduce considerations that impact the balance between data privacy and open access.
Personally identifiable data excepted from the US Freedom of Information Act (FOIA) should not be less meaningful because it contains names, addresses or rare disease indications. What if we could honor the FOIA spirit of openness while protecting privacy? And what if non-coders could use cloud computation resources to perform the job in the agencies where they work?
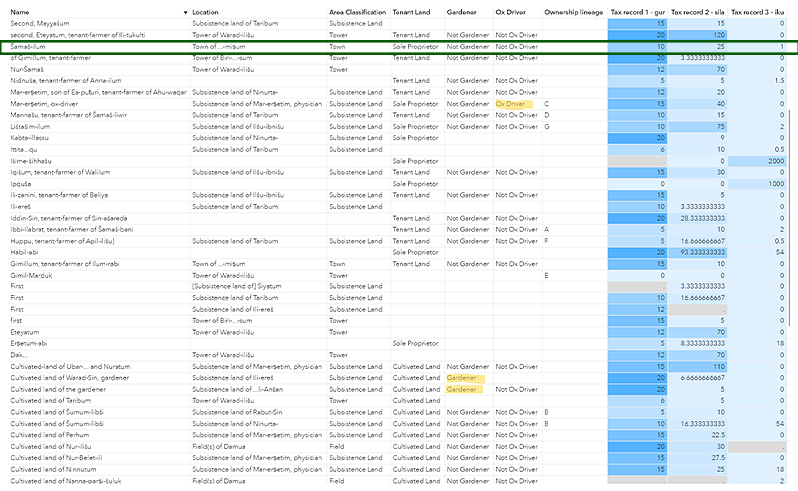
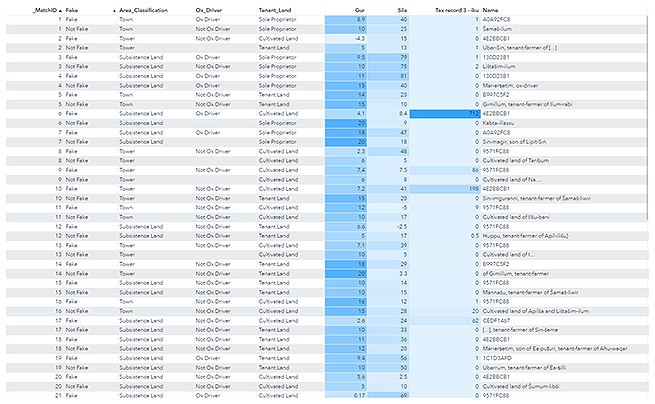
Through the anonymization process of the aforementioned 4,000-year-old Babylonian tax data set (Figure 1), this is how government agencies can open anonymized citizen-level data and do it well using those three principles. Let’s talk about it in detail.
1. Embracing rare attributes
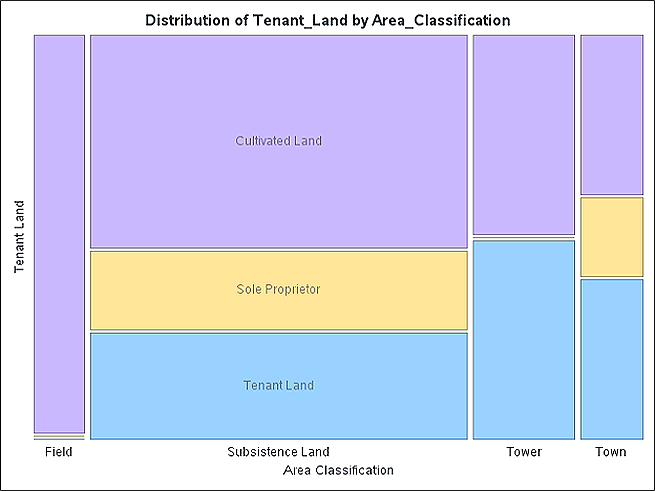
In modern statistical departments, aggregated summaries are commonly used to present data to the public. However, while these summaries are efficient for broader analysis, they often wash out rare attributes at lower unit levels. For example, in our Babylonian tax data set (Figure 1), aggregation information loss would include rare occupations of ox driver and gardener or unary disaggregated data points, like the only “sole proprietorship in town” (the sole case of Šamaš-ilum, highlighted by the green box in Figure 1).
Aggregations limit data richness and stifle the representation of diverse elements. In contrast, data synthesis offers an account of the rare attributes (e.g., “ox driver”) while disclaiming individual data provenance.
2. Combining statistics and machine learning
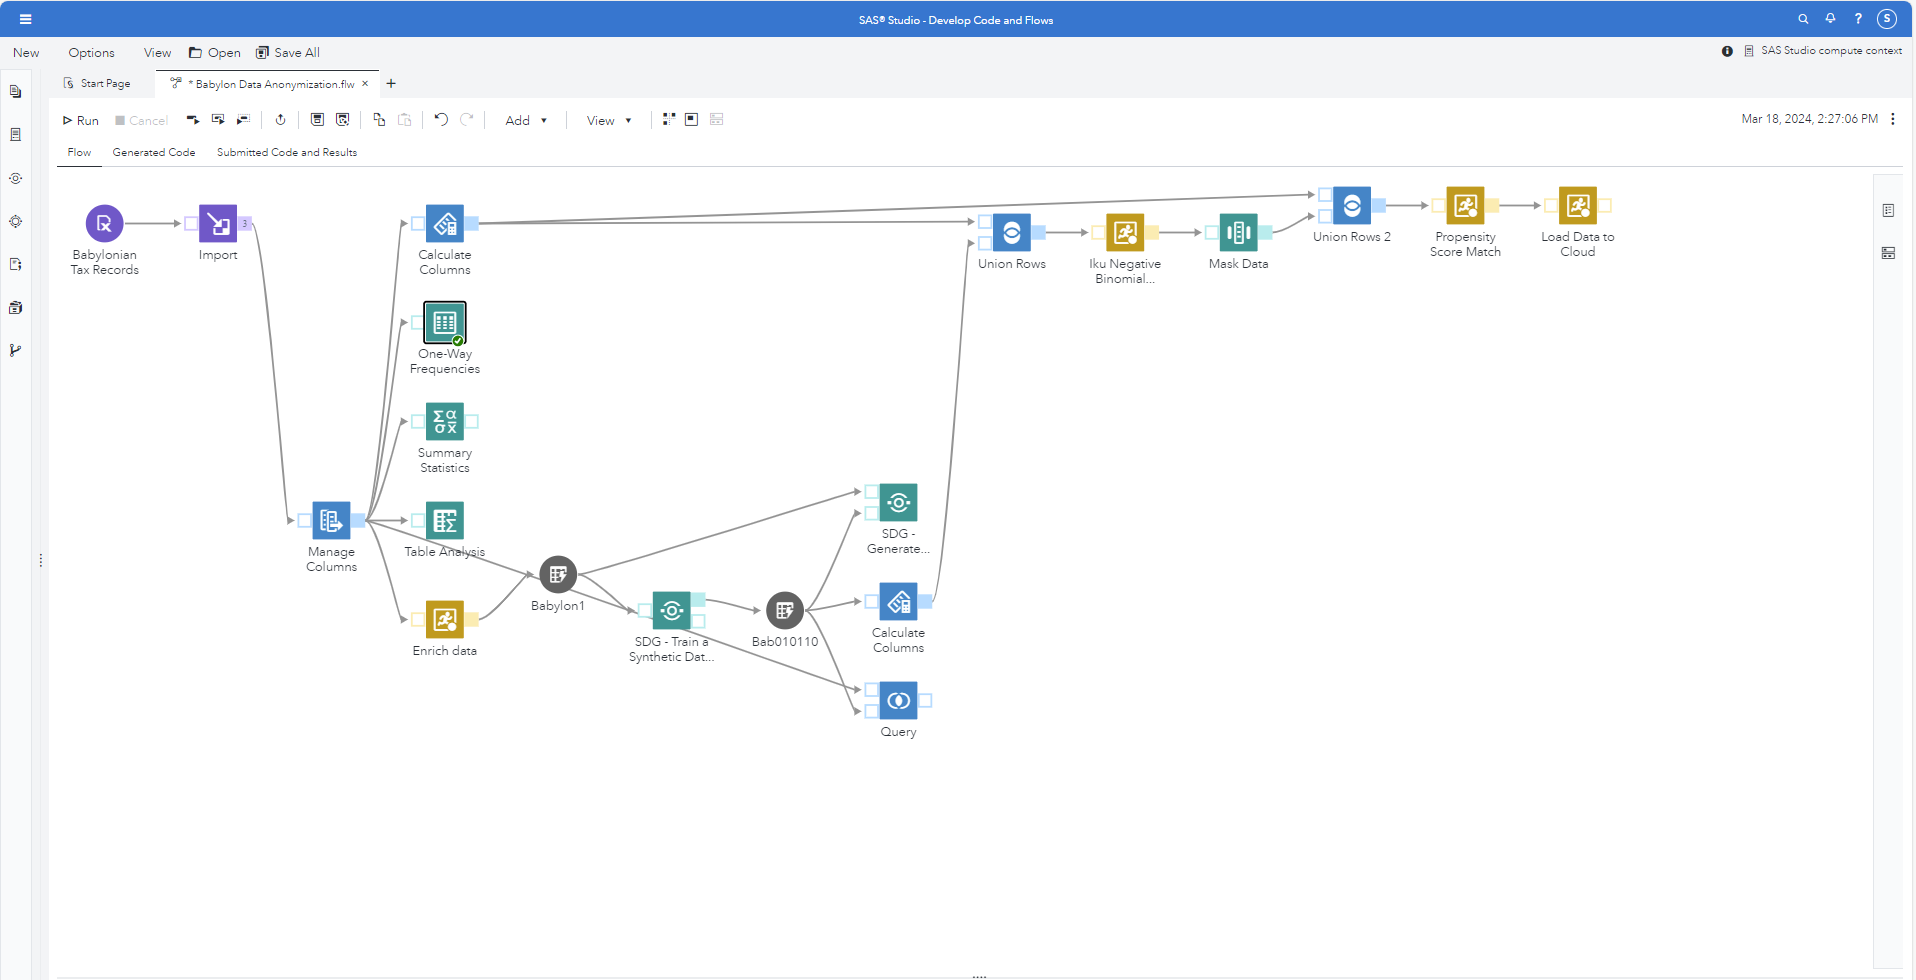
Even without being a skilled coder or an ancient Near East document interpreter, I could count on the multimodal analytics capabilities in SAS® Viya® to iteratively prep, explore, model and make decisions on data synthesis. At the center of my workflow was a synthetic data generator (SDG) – for which there is a no-code step for Viya 4 installations of SAS Studio Flow. The basis of this step is a Correlation-Preserving Conditional Tabular Generative Adversarial Network (CPCTGAN) that works well with continuous, ordinal and nominal data. Other machine learning-based algorithms, such as the Synthetic Minority Oversampling Technique (SMOTE), are available in SAS.
The SDG Step produced results that nicely preserved weak correlations of the continuous tax elements (Figures 4a and b). Close inspection of the data showed negative numbers appear in several continuous measures, especially “Iku,” where the original data set showed a deep left skew, bounded by its mode of 0 (Figure 4c).
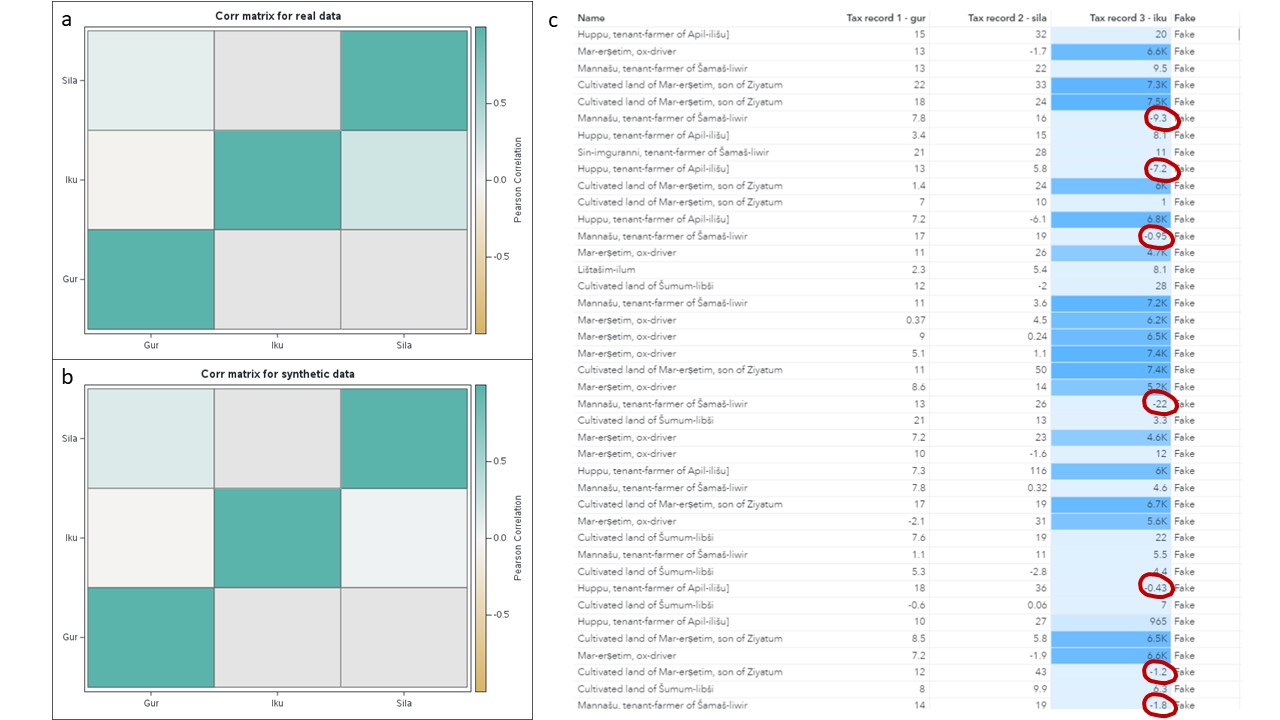
Enter statistical modeling that created highly plausible Iku results! Using the code-writing assistant, SAS Task (also available in SAS Studio in Viya 4), I created a statistical model to score and overwrite the SDG-generated Iku value. Statistics + Machine Learning = Success!
3. Stewarding anonymization fidelity
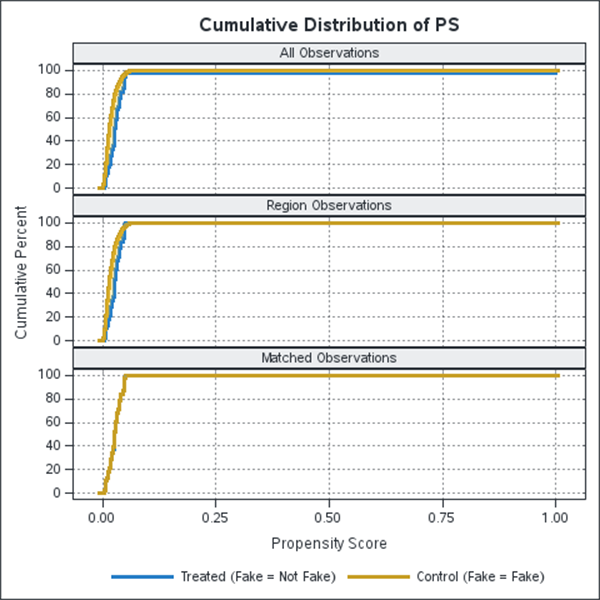
To ensure quality, the data synthesis team could create additional strata to offset sampling bias and take steps to test re-identification potential through managed data or subsets of only the most plausible synthetic records. To accomplish this, I took the surfeit of SDG-generated data (hundreds of thousands of samples can easily be generated). Then, I short-listed the most plausible through Propensity Score Matching. The output data set well reflected the actual samples on all axes of diversity (Figure 5).
The result of back-end fidelity checks, or anonymized data stewardship, is that the synthetic data maintains important attributes of real data that prevent data re-identification. Such fine-tuning prevents data fuzziness, which is currently a problem for neighborhood-level data offered by the US Census Bureau.
A historical perspective
Hamurabi posted his code publicly, a social innovation venerated across social studies curricula. Ancient Fertile Crescent mathematical innovations seem less known, such as when Sumerians began representing “whos” by “whats,” row by column, into a table. These easy-tally tablets named people, their occupations and aspects of each citizen’s relationship to the state. The Babylonians, and eventually the written world, inherited the Sumerian innovation of tabular data.
In hindsight, we might celebrate these societies’ computational efficiency and openness to data access while taking their complete disregard for individual privacy. The multimodal analytics system of SAS Viya gave me, a low-skill coder unfamiliar with Babylonian tax records, a way to generate plausible anonymized records in six hours (including plenty of doubling back, learning as I went and going the extra mile for quality). The result was pretty good: a synthetic tabular data set that maximized data openness, efficiency and privacy protection (Figure 6).
Imagine the possibility of toppling every unnecessary agency firewall so that citizens, including citizen data scientists, could connect the dots for themselves. The technology is ready. Are we?

1 Comment
I am so impressed with this demo showing this is not a nice to have check box, but rather a full featured capability I could point a customer to today.