Often the biggest challenge when implementing a successful forecasting process has nothing to do with the analytics. Forecast adoption – incorporating forecasts into decision-making – is just as high a hurdle to overcome as the models themselves.
Forecasting is more than analytical models
Developing a forecasting process typically begins with producing robust and sophisticated models. This is no small feat. First, data scientists must obtain large volumes of diverse data, then manipulate and transform it to become analytics-ready. Next, they apply a breadth of modeling techniques, from time series to machine learning and everything in-between, to generate forecasts at varying levels of detail. Data scientists frequently test and refine forecast methods to meet accuracy expectations.
The challenge then becomes building a repeatable workflow for reviewing exceptions and fine-tuning models. Once operationalized, forecasts are integrated into downstream planning and execution systems so that business users can consume them. Forecast consumers include demand, assortment, financial, labor and inventory planners. For simplicity, let's call them "planners". The forecasting process regularly repeats to align with planning cycles, with up-to-date data and refreshed forecasts.
All these efforts are essential for forecasting. However, data scientists often find that planners don't use statistical forecasts. Some companies report that planners still adjust 80-90% of forecasts, despite consistently strong accuracy results. Why? Because it's not about the statistical forecast itself; it's about trusting the forecast.
Trust leads to adoption
Trust is vital for building credibility in new forecasting processes. It's clear when you've earned trust: when you attend a meeting, colleagues nod their heads and truly listen when you talk; when decision-makers question a recommendation, they immediately look to you to confirm or deny. Trust is a challenging thing to earn. And it doesn't just miraculously show up because of your title or because leadership says so. It takes time to develop trust and it's a progression, not an endpoint.
Establishing trust and gaining forecast adoption involves trusting the analytics, the results and the people who produce the forecasts.
Trust the analytics: Explain forecasts clearly
New business processes are naturally met with some degree of skepticism. Introducing a new statistical forecast is no different. Planners may question, "Will this forecast help me? Will it replace my knowledge and experience? Will it perform as well as the data scientists say it will?"
Overcoming this hesitancy starts with explaining the purpose of statistical forecasts. In a planning workflow, how should planners use the forecast to improve decisions? The answer depends on many factors, such as the level of detail in the forecast, causal data included and frequency of updates.
For example, consider a consumer goods company that has developed multiple statistical forecasts to help demand planners with aggregate and detailed planning. Aggregate forecasts are created at a higher level in the product/location hierarchy, at the brand/channel level, and are designed for strategic decisions. More specifically, they help demand planners determine where to invest across trade, marketing and innovation.
On the other hand, detailed forecasts are at a much lower level of detail, at the SKU/customer level. The detailed forecast's precision targets executional decisions by identifying risks and opportunities in the plan. Demand planners should not use the aggregate and detailed forecasts interchangeably since each forecast is developed for a specific purpose.
In practice, forecasts can serve multiple purposes depending on the product category. Planners lean heavily on statistical forecasts in high volume, low volatility categories. Alternatively, statistical forecasts are a baseline starting point for layering future initiatives in intermittent or seasonal categories.
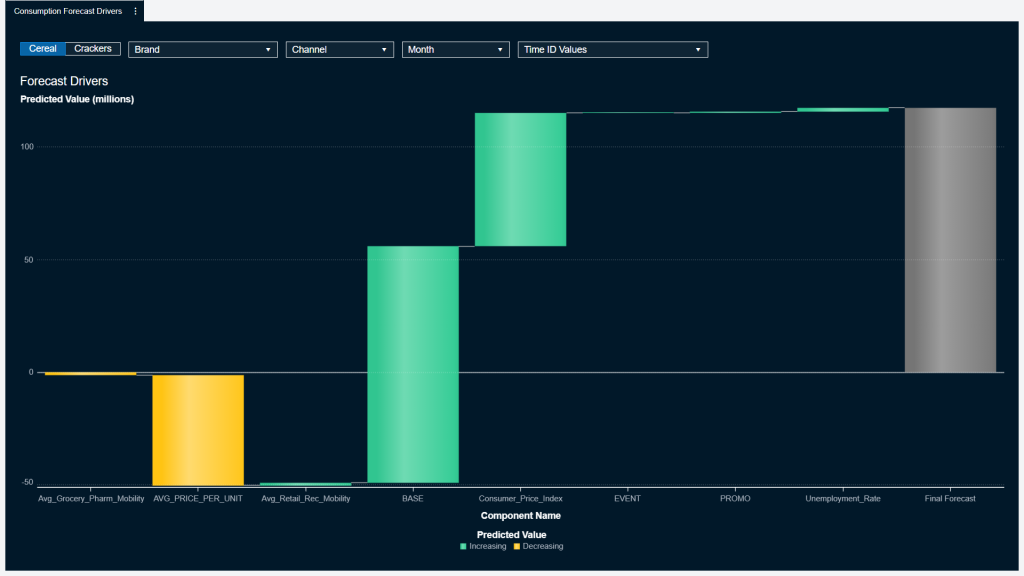
Once data scientists define and communicate the forecast's purpose, gaining trust in the analytics involves explaining the analytical models themselves. This begins with identifying and quantifying the underlying drivers of the forecast. What causal data is included in the forecast? Equally important, what causal data is not in the forecast?
Data scientists employ various techniques for automatically calculating the impact of causal variables, with unique methodologies for time series, machine learning and ensemble models.
The resulting forecast model explainability is more meaningful from a business perspective than a technical itemization of mathematical model components. In other words, forecasts are better understood when they are decomposed into practical buckets, such as holiday, promotional and economic effects.
Subsequently, illustrating forecast drivers visually and interactively across the product/location hierarchy ensures planners can effortlessly interpret them. This leads to a clear understanding of forecast models while bringing visibility to how forecasts change when causal inputs or historical trends shift. (See Figure 1.)
Trust the results: Prove meaningful benefits
Planners are more likely to trust statistical forecasts that consistently produce reliable results. To that end, publishing forecast performance dashboards is central to encouraging trust in analytical models.
In fact, many data science teams distribute forecast accuracy dashboards regularly. However, when planners receive a mountain of dashboards, forecasting reports may be only glanced at – or overlooked completely. How does this perception change?
Forecasting dashboards designed to promote fact-based insights into historical performance are tools for actively understanding what has been successful and then leveraging that knowledge to improve results in the future. Visibility to performance across brands, channels and customers presents opportunities for improving data, forecasts and planning decisions.
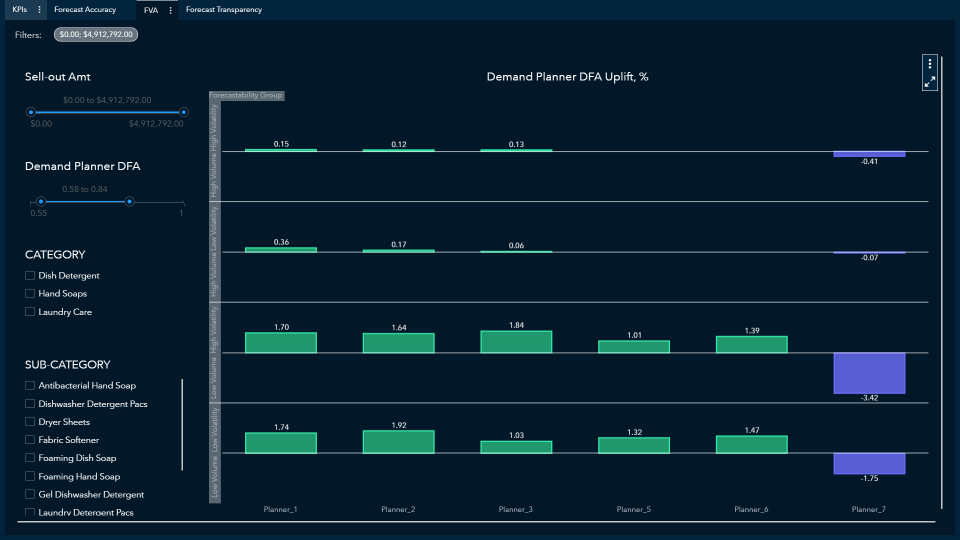
It's essential to look at forecast performance from several perspectives: forecast accuracy measured in mean absolute percent error (MAPE) or weighted MAPE, forecast bias, forecast churn and Forecast Value Add (FVA), to name a few. For instance, the total weighted MAPE identifies exceptions that need attention, while forecast bias helps avoid consistently over- or under-forecasting. Using forecast churn, data scientists are better able to detect changes in historical demand or a need to adjust statistical models. Forecast Value Add (FVA) guides planners on how they can efficiently and effectively spend their time. (See Figure 2.)
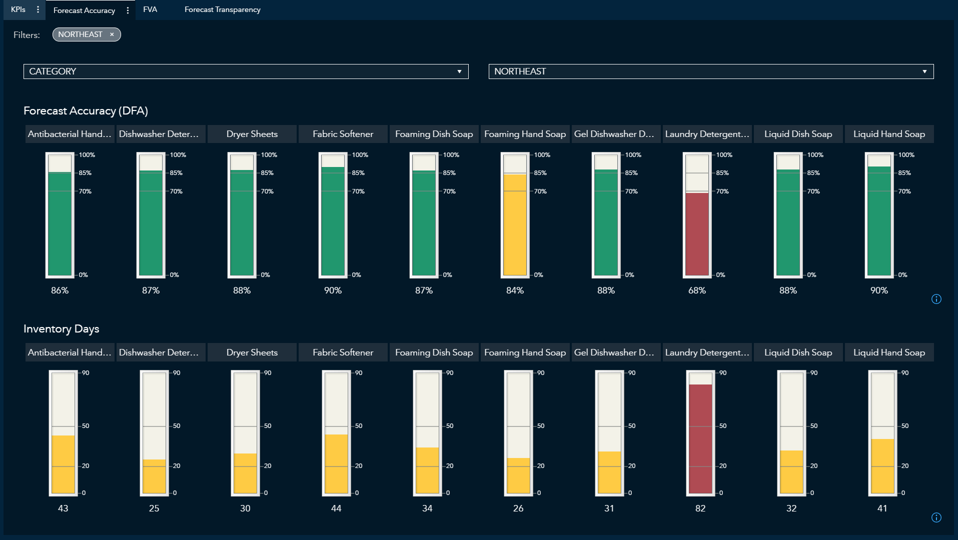
Translating forecast accuracy into meaningful KPIs for planners, such as reduced inventory, increased service level and improved process efficiencies, solidifies the direct connection between accurate forecasts and bottom-line results. (See Figure 3.)
With so many forecast accuracy measures to choose from, the objective is not to inundate planners with every possible statistic. Forecast performance dashboards become valuable when they include a manageable subset of accuracy metrics that resonate with your organization. Explaining the purpose of each metric improves the ability to take action.
Unless actively consuming forecast performance dashboards is prioritized, reports can easily be ignored. Simply publishing dashboards is less impactful than incorporating them into a collaborative, repeatable process. To take this further, adding forecast accuracy and adoption as an annual business goal for data scientists and planners incentivizes mutual accountability for producing high-quality forecasts.
Trust the people: Empower data scientists
Trust is about building relationships. The strength of the relationship between data scientists and planners can significantly influence the perception of statistical forecasts.
In the early stages of a new forecasting process, the credibility of planners who have 'walked in the same shoes' is initially stronger than the voice of the data scientists. Leveraging the trust already established, data scientists can identify sponsors in the planning organization to champion the statistical forecast.
Developing relationships across planners with disparate viewpoints is critical: actively engage the planner who inherently believes in the statistical forecast and the planner who is the forecast's biggest skeptic. To cultivate trust, data scientists can arrange recurring collaborative discussions with planners to review insights from forecast explainability and performance dashboards.


Through these discussions, data scientists understand alternate perspectives on how statistical forecasts help planning decisions. This feedback integrates into continuous forecast enhancements, such as additional internal and external data, innovative forecast methodologies and process refinements.
As the relationship between planners and data scientists strengthens, data scientists' roles evolve well beyond maintaining statistical models. Data scientists are empowered to become strategic partners for planners and are trusted advisors offering analytics-based insights to help drive valuable results.
This reinforced trust inherently boosts the statistical forecast to become more than just a reference line; it becomes the barometer for risk and opportunity, more efficient planning and better decisions.
The recap
Far too often, forecast adoption is an afterthought. Making forecast adoption a priority helps bring trust to the forefront of forecasting and planning processes. Trusting statistical forecasts requires understanding the purpose and underlying factors of the forecast. Relying on the forecast accuracy results demands meaningful performance dashboards embedded into a collaborative business process. Trusting the data scientists involves intentionally developing relationships with mutual accountability for the results. With this trust comes forecast adoption.