Ever heard of a Turducken? It's a chicken stuffed inside a duck that's stuffed inside a turkey along with layers of stuffing (which I just learned is referred to as a three-bird roast outside the US and Canada; there's also an English variant known as a gooducken, where the turkey is replaced with a goose -- who knew?).
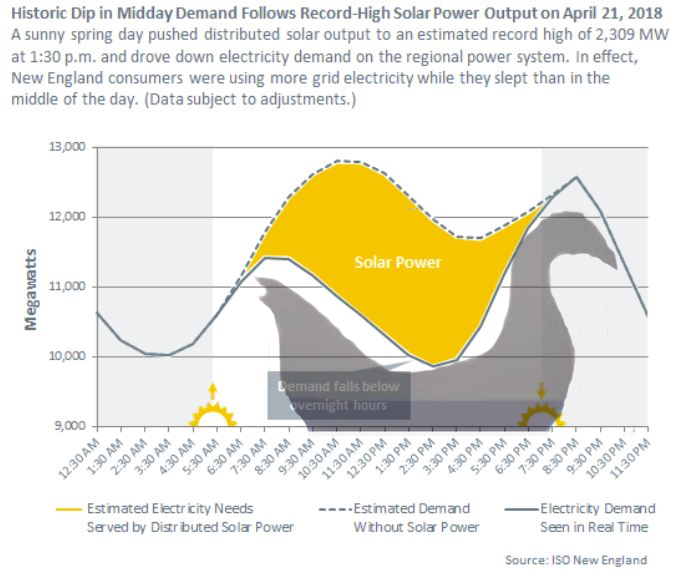
How does this relate to the Duck Curve? Well, the Duck Curve shows electricity demand over the course of a day, and highlights the impact of renewable energy production on this demand. With renewables generating an ever-increasing amount of electricity, there's reduced reliance on conventional generators to meet the demand. This results in what's seen as an overall reduced electricity demand at the system level.
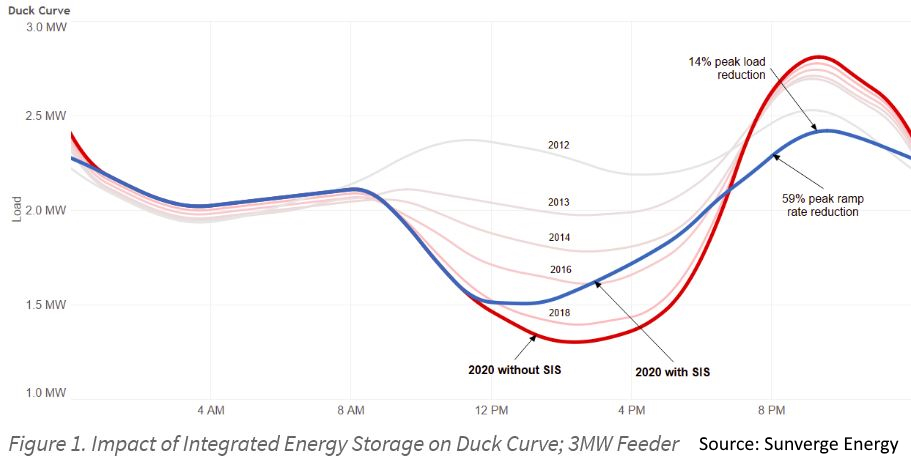
It's my understanding that the term "Duck Curve" was first coined in 2012 by the California Independent System Operator (CAISO). In my opinion, the Duck Curve is mostly associated with solar adoption. I agree that, when looking at one renewable resource (especially solar), the curve is appropriately named because, as you can see in Figure 1 below the graph looks like the outline of a duck.
However, I would argue that instead of just the Duck Curve, utility grid managers are really dealing with a Turducken Curve. Why? Because solar is not the only renewable asset with a different generation profile than conventional (fossil-fuel) generators, and you need to consider multiple renewable assets (layering them with solar just as the turducken layers the duck, chicken and turkey).
The variability in standard or conventional power generation (coal, natural gas, nuclear and even hydro) is easier to understand and control -- even taking into account that nuclear and hydro aren't necessarily easy to turn on and off.
Just as the impact of solar PV creates a type of duck curve, wind power can produce a different type of curve. Then there's animal waste, such as pig power, that has a different curve. It's typical to see and study this curve as it pertains to multiple years and, as a result, one ends up with multiple Duck Curves on the same graph representing different years. When you add in energy storage technology (which helps address this imbalance that occurs), and then overlay this impact into the graph, you alter the graph even more as seen in Figure 2 below.
As a result, I think the utility industry should start discussing how best to address or work with the "Turducken Curve" vs. trying to deal with a simple Duck Curve. Whether you're looking to improve your ability to address the impacts associated with a Duck Curve -- or the more complex Turducken Curve -- analytics (such as forecasting, machine learning and artificial intelligence) will help you better understand this imbalance, and how best to address not just one imbalance, but the interaction of multiple energy resource imbalances -- all impacted by external factors such as weather, time of year, and shifting customer behavior (i.e. COVID-19).