Adverse outcomes, and the rapid spread of COVID-19, have accelerated research on all aspects of the disease. You may have found it overwhelming, and very time-consuming, to find relevant and specialized insights in all the scientific literature out there.
To aid researchers in quickly identifying relevant literature about key topics of interest, SAS has released the COVID-19 Scientific Literature Search and Text Analysis environment. This visual text analysis environment is free to the public and includes text from more than 50,000 full-text scientific documents from the COVID-19 Open Research Dataset (CORD-19). The research environment uses artificial intelligence, natural language processing, linguistic rules, and advanced modeling techniques—along with subject matter experts’ inputs—to help simplify research and locate relevant information.
This environment allows you to:
- Interactively explore relevant research on a variety of coronavirus topics—such as incubation period, genetic variations, risk assessment, epidemiology, PPE, drug treatments, and social mitigation efforts.
- Visualize extracted keywords and summarized quantitative data.
- Quickly identify networks of co-citations and the authoritativeness of papers using network analysis visualization.
- Search for your own key terms in the documents using free text search.
Let's look at this environment
When you first log on, you will see a brief summary page that provides background information on the environment.
This environment provides five different ways to slice and dice the scientific literature:
- Free Text Search
- System-Identified Themes
- Expert-Identified Themes
- Numerical Themes
- Co-Citation Network
Numerical themes reveal insights
This application is designed to assist a wide range of users. Let’s walk through the tabs as if we were an epidemiologist seeking answers to specific questions about the virus. If we look back to when the disease first became pandemic, there was an overwhelming amount of research published. From an epidemiological perspective, it’s important to answer key questions that help mitigate a pandemic—such as incubation period, reproduction number (r naught), and serial interval—as early as possible. Having this type of information extracted and summarized from all the literature in a timely manner becomes crucial.
Since the answers to these questions are numerical in nature, we’ll first start on the Numerical Themes page. The data within this page was extracted using SAS information extraction models developed by subject-matter experts and text analytics specialists. Contextual cues and grammatical information were also considered.
Incubation period
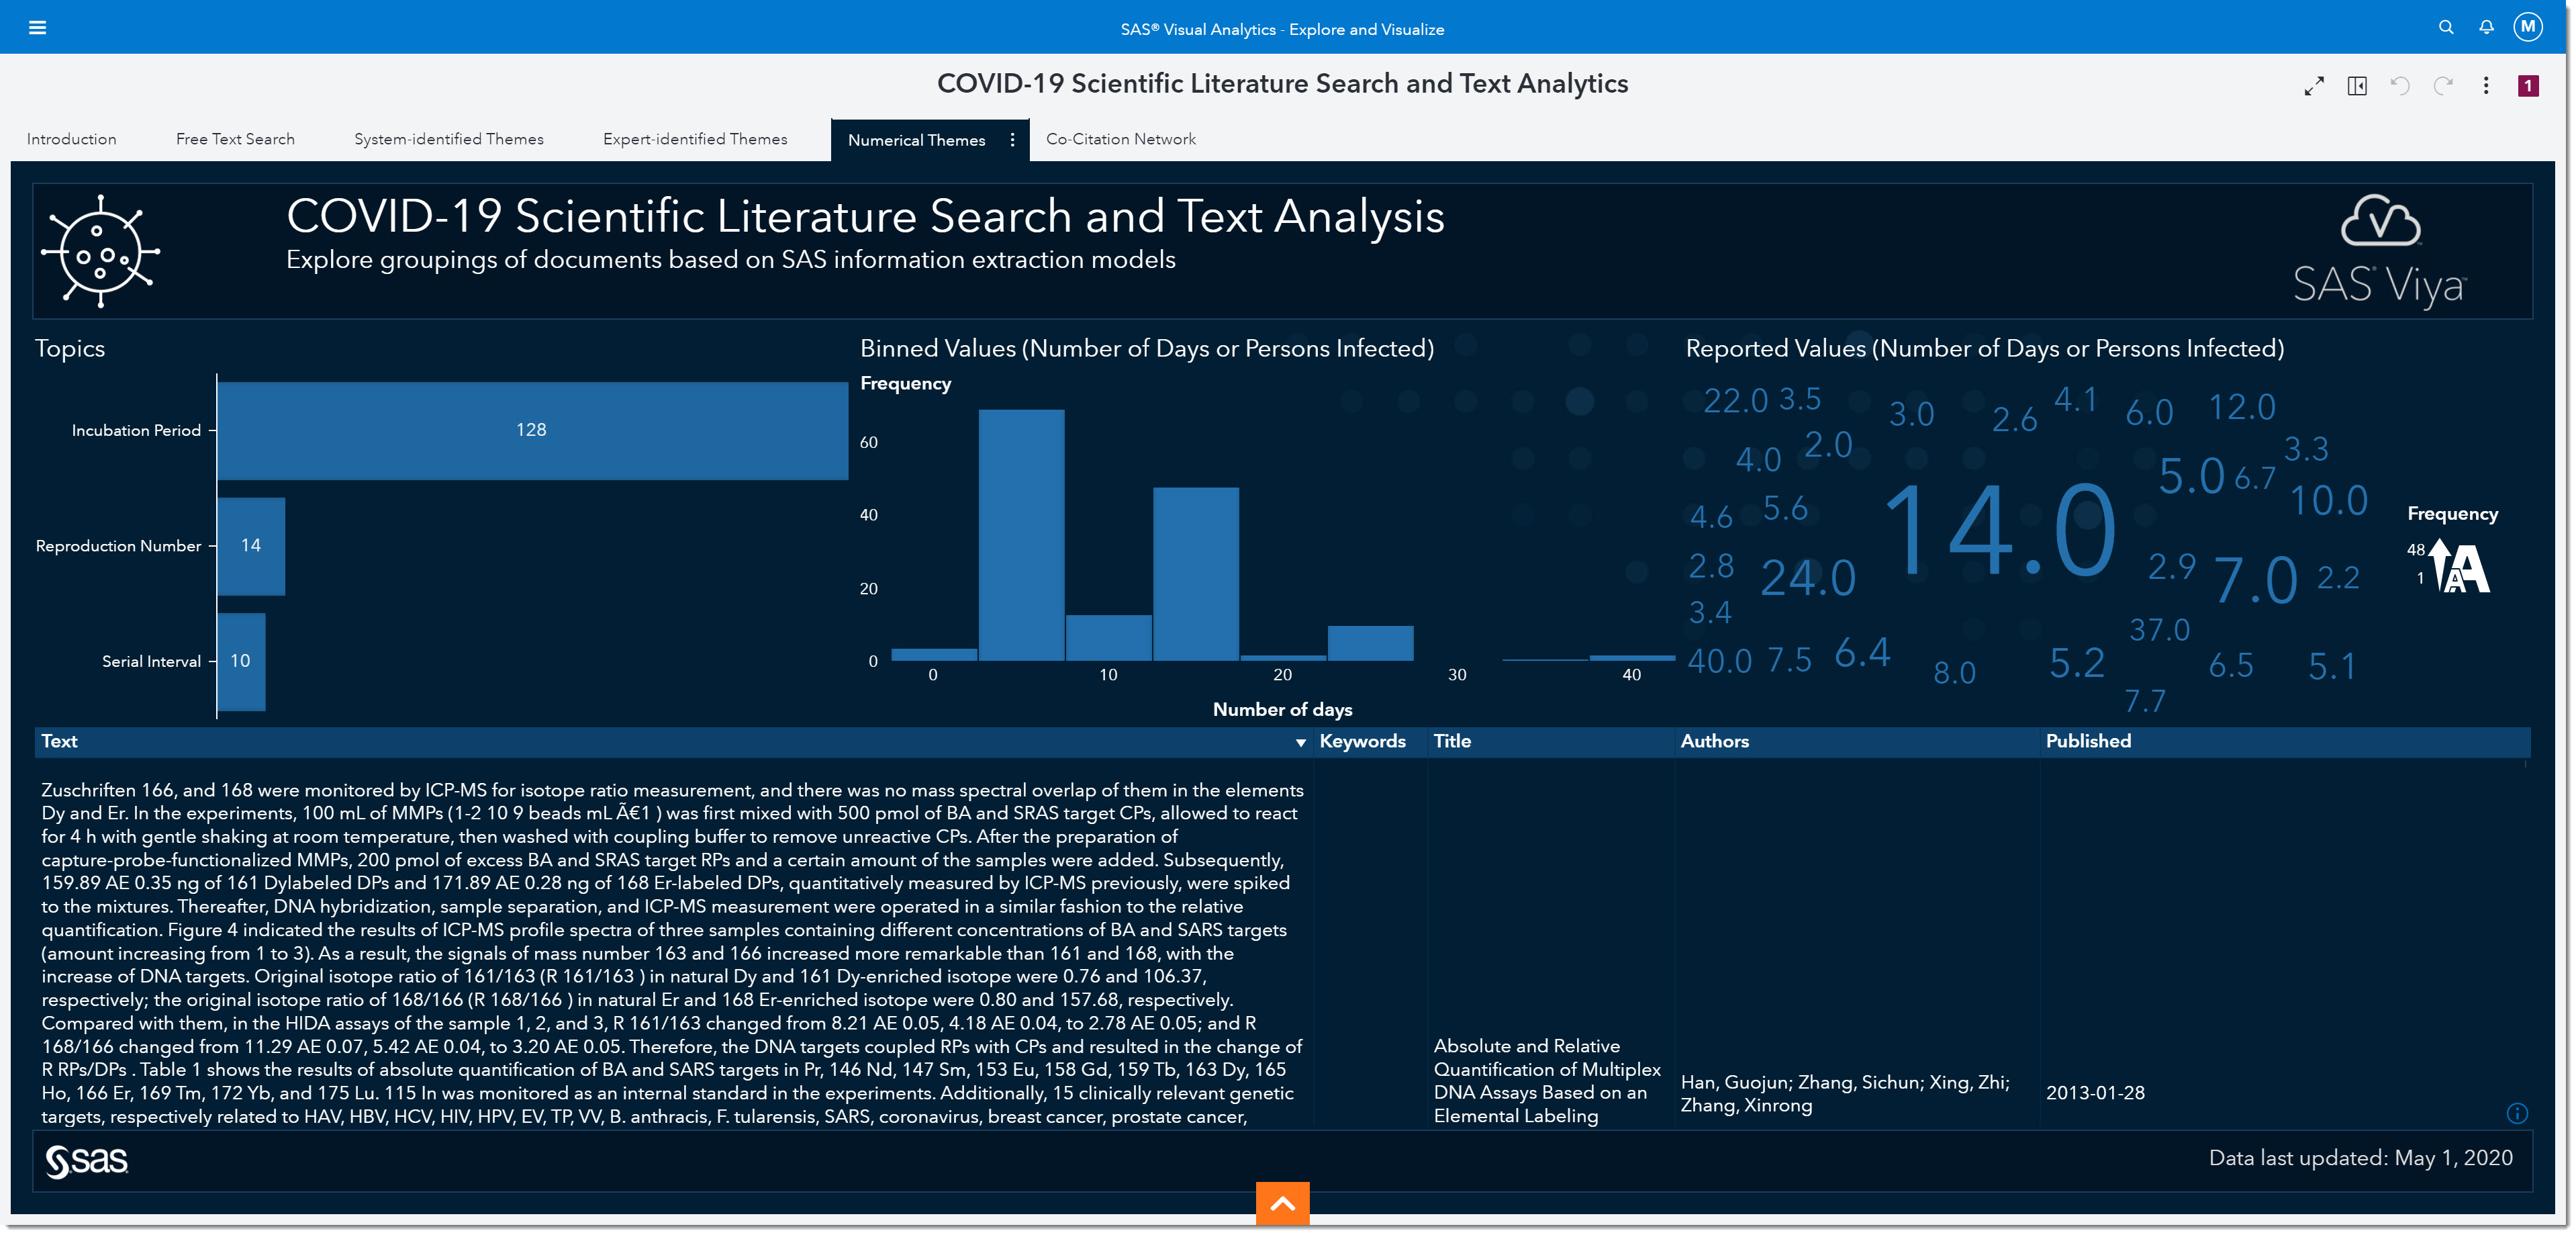
Let’s focus on analyzing the incubation period. The incubation period is defined as the time interval between initial contact with an infectious agent and the appearance of the first sign or symptom of the disease. Because we are interested in the incubation period, we will select that bar from the bar chart on the left. The number on the bar tells us the number of mentions the incubation period has within the data.
Interestingly, we’ve all heard about 14 days being one of the most widely observed numbers for the incubation period. In fact, many of today’s social distancing initiatives are based on that information. But if we look at the word cloud on the right, we can see many other numbers have been reported.
![]()
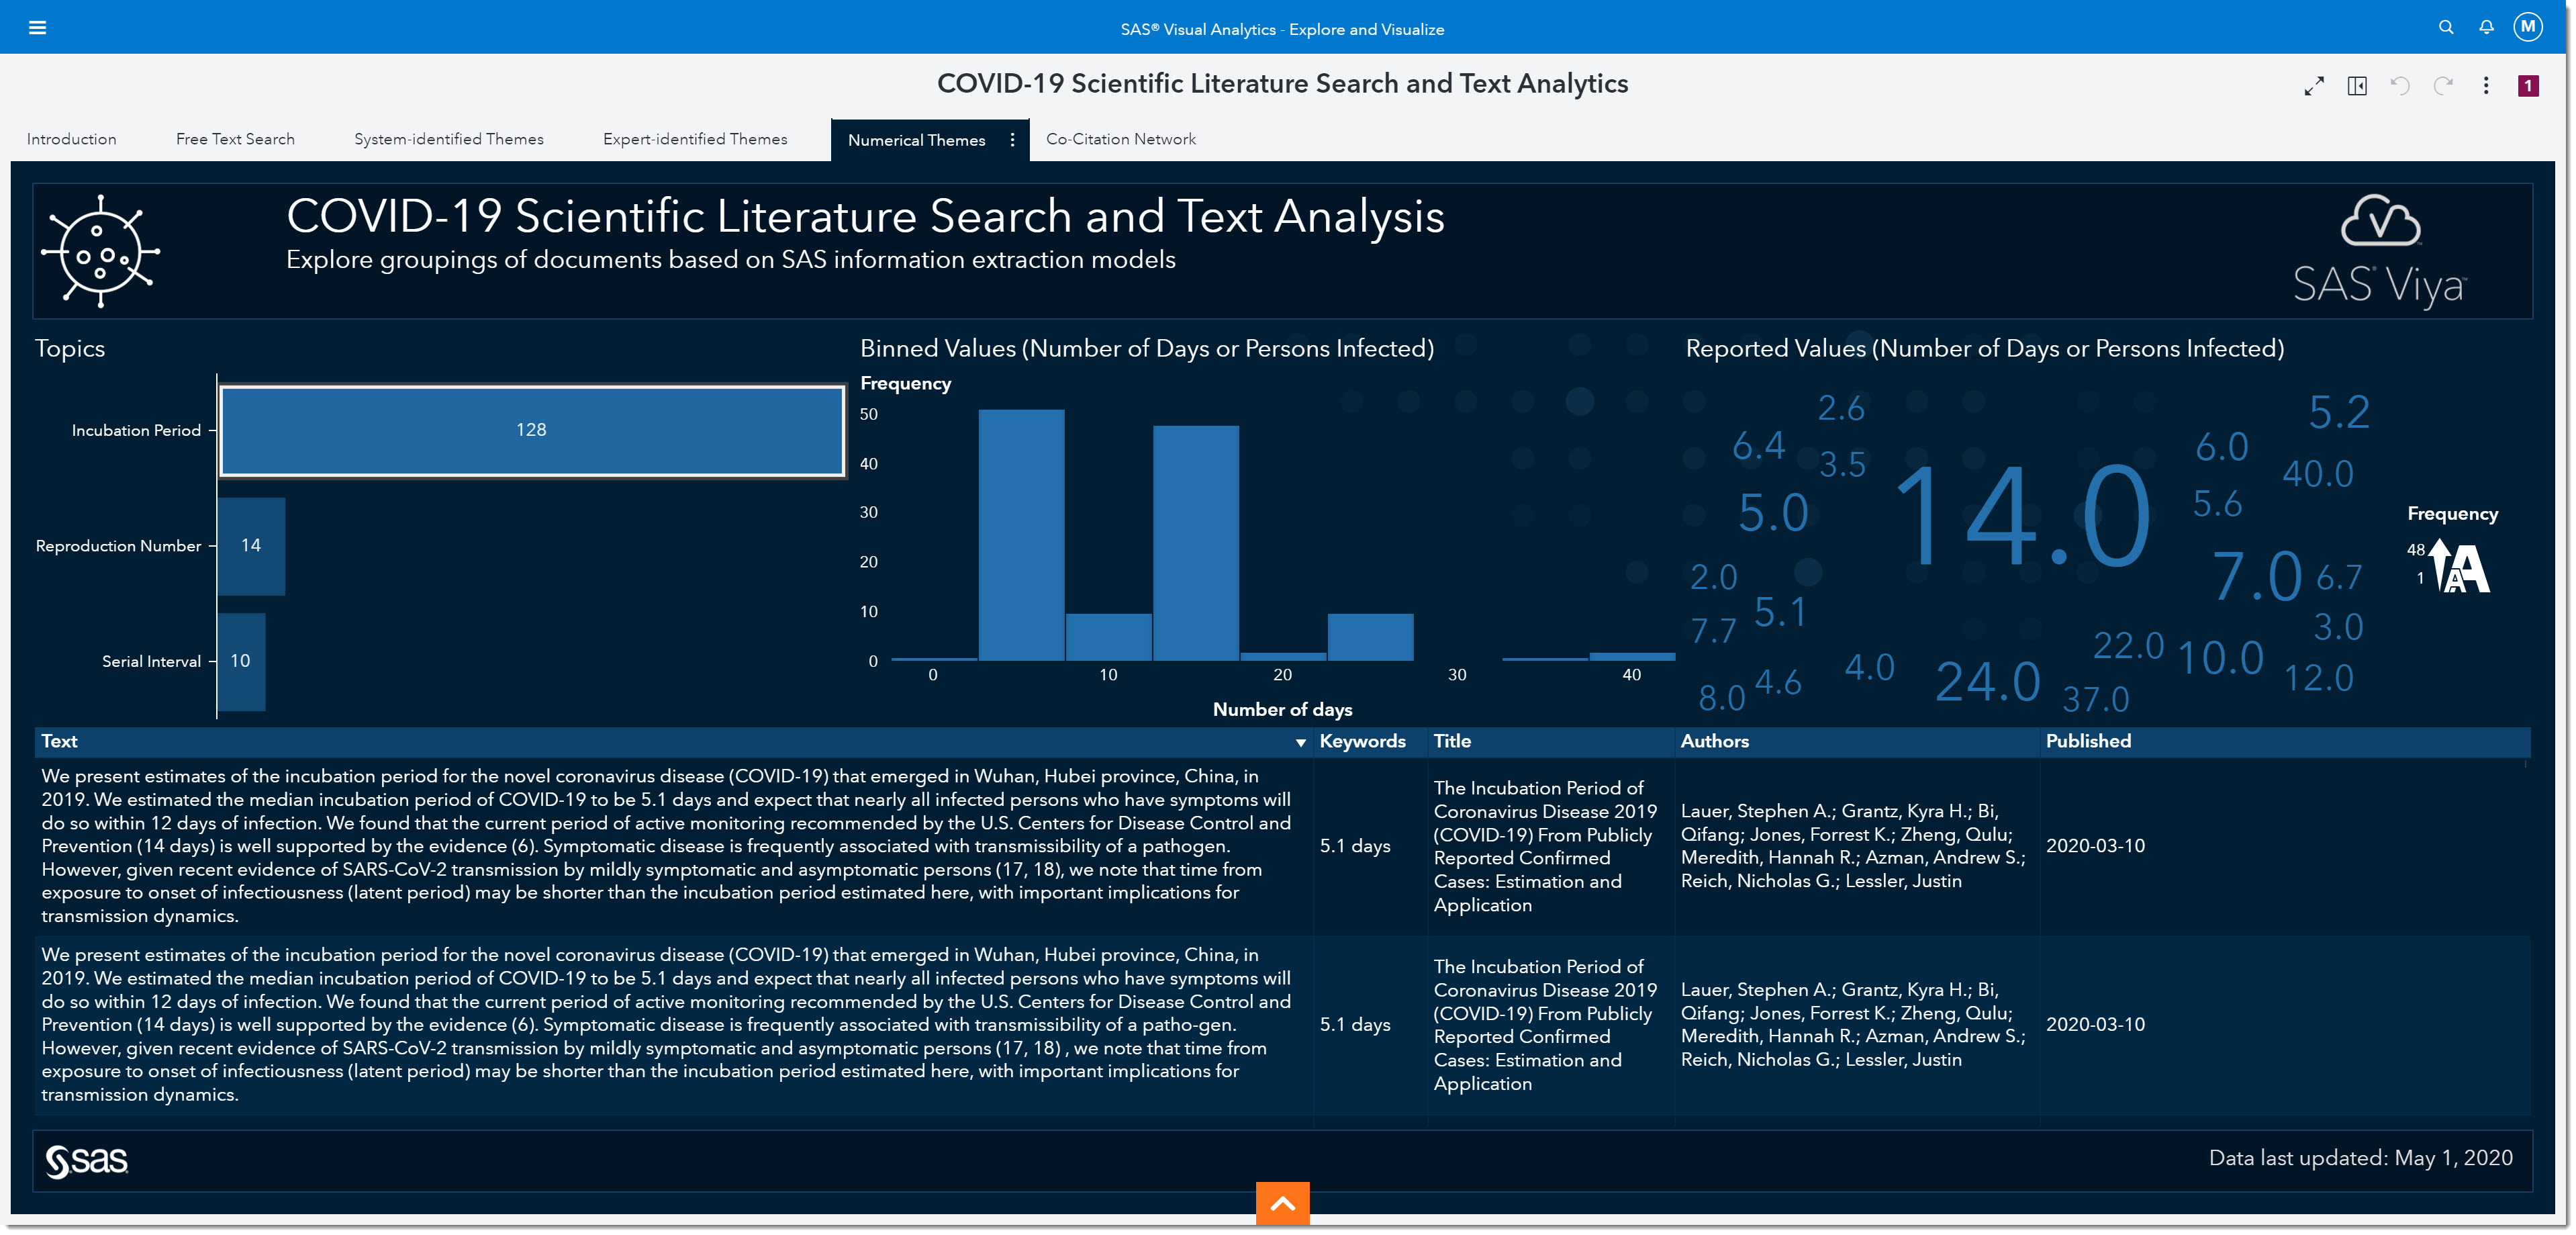
If we bin the reported values, we can see that the most reported range for the incubation period is somewhere between 2.5 and 7.5 days, with the middle of that range being around 5. In other words, the most-often reported incubation period is between the values of 2.5 and 7.5 days.
![]()
As more research has been made public over the past several months, it’s become well documented that the incubation period is between 5 to 5.2 days. This is, of course, in retrospect—but what will happen to this number when the second wave hits or if other variables change as the pandemic goes through an evolution? Being able to quickly identify how the change in these numbers are reported in day-to-day research is key to ensuring appropriate responses are implemented to mitigate the negative outcomes of the disease.
At the bottom of the page, you will find the bibliographic details and most relevant paragraph of text from the scientific papers that mentioned the incubation period.
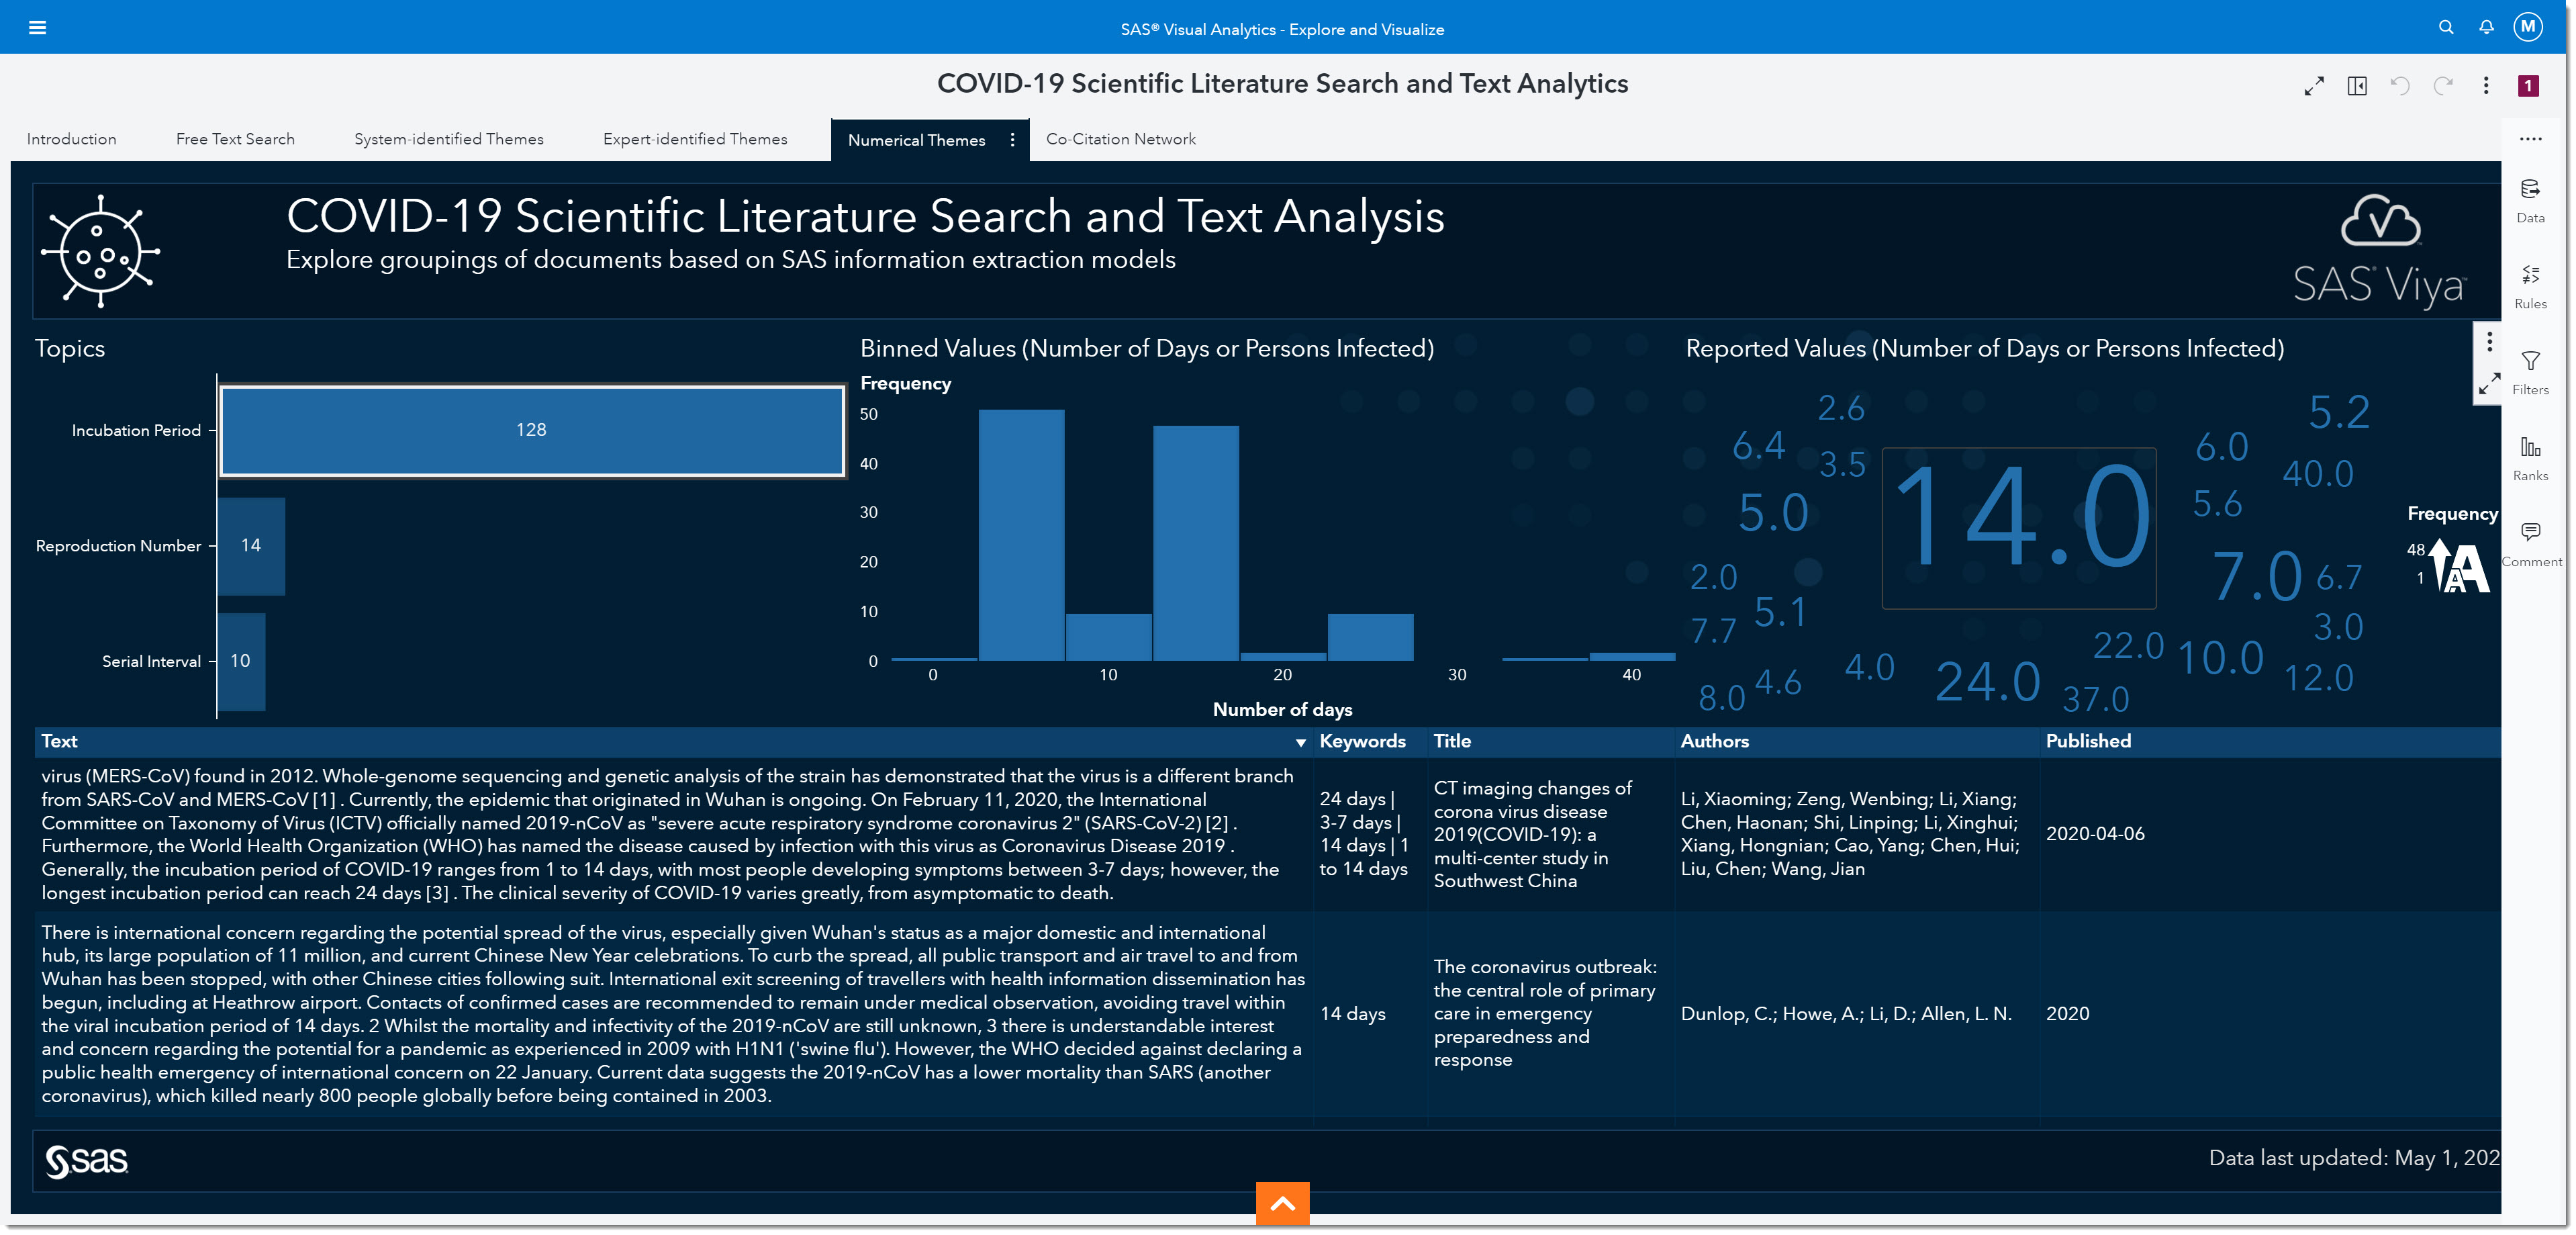
We could look at the published date and keywords to identify if recent publications are consistent with what we have seen to date. We can read the paragraph and, if we want to see the full article, double click on that record to open the full article from its source. While this information is key for epidemiologists at the beginning of a pandemic, it remains important as the disease progresses and we discover other variables that might impact the virus’ effect. More and more research is continuously being published—so having this quick view into key measures, and knowing that it’s an accumulation of tens of thousands of articles, is invaluable.
Epidemiologists identify important themes
As epidemiologists, there are many other topics we might want to investigate that don’t necessarily have numerical answers. Let’s look at the Expert-identified Themes tab, which provides qualitative answers. Similar to the Numerical Themes tab, the results here are produced from linguistic rules identified by linguists in collaboration with health and life sciences subject matter experts.
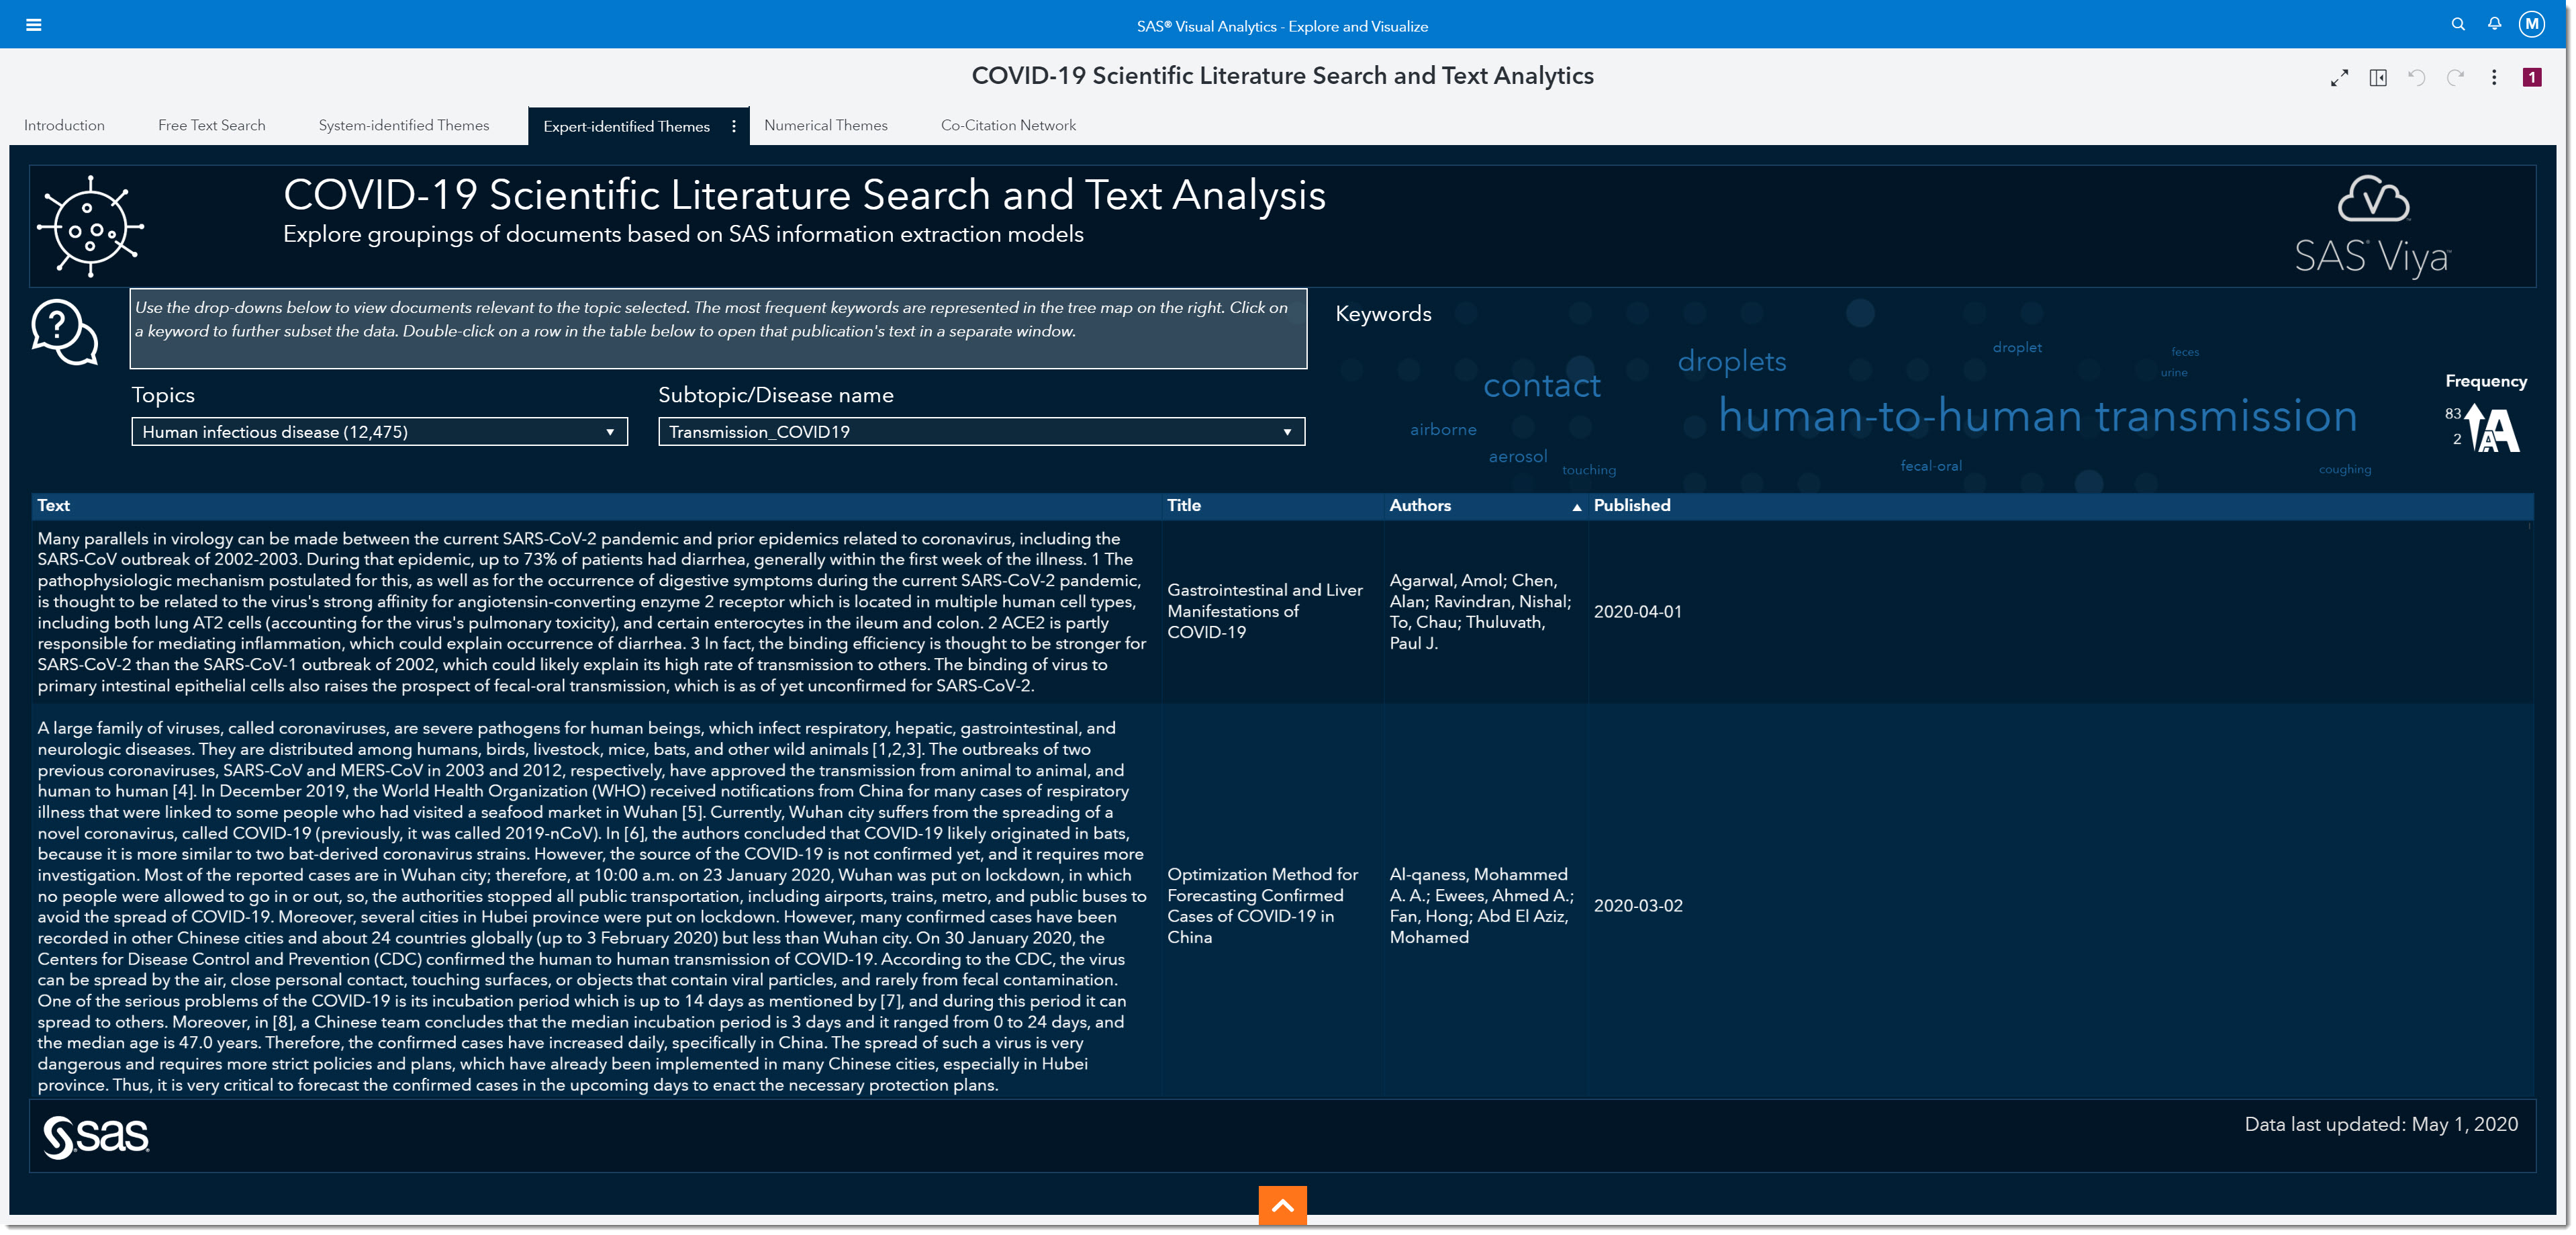
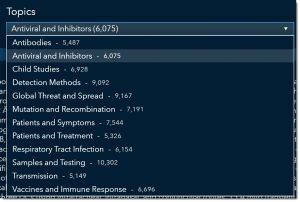
Using the Topic and Subtopic/Disease name drop-downs, we can filter the data to focus on certain expert-identified themes. There are currently 5 key topics and each topic has numerous subtopics by disease. As the data is updated, other key topics and subtopics may be added. Having the subtopics by disease type allows us to compare and contrast COVID-19 with other coronaviruses, such as SARS or MERS.
Viral load
As epidemiologists—having looked at incubation period, reproduction numbers, and serial interval—we now have a pretty good understanding of how fast this virus is moving through the population. Next, we might be interested in understanding more about human-to-human transmission. We might be interested in the viral load (strength) of COVID-19, as it has a strong correlation to infectability.
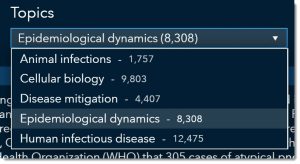
So, we’ll select Epidemiological dynamics from the topic drop-down.
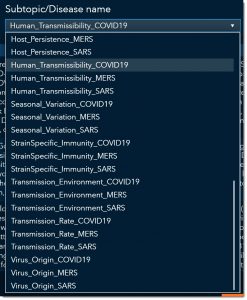
Then we’ll select Human_Transmissibility_COVID19. Notice that there are other categories we could have chosen such as seasonal variation, strain-specific immunity host persistence, etc.
Before we move forward in our search, let’s look at the word cloud. The word cloud shows us that the keyword transmissions show up the most in this subgroup of articles, followed by the words human-to-human (the larger the word the more frequent it occurs). I’ll focus on articles that specifically mention transmission, by selecting transmission from the word cloud.
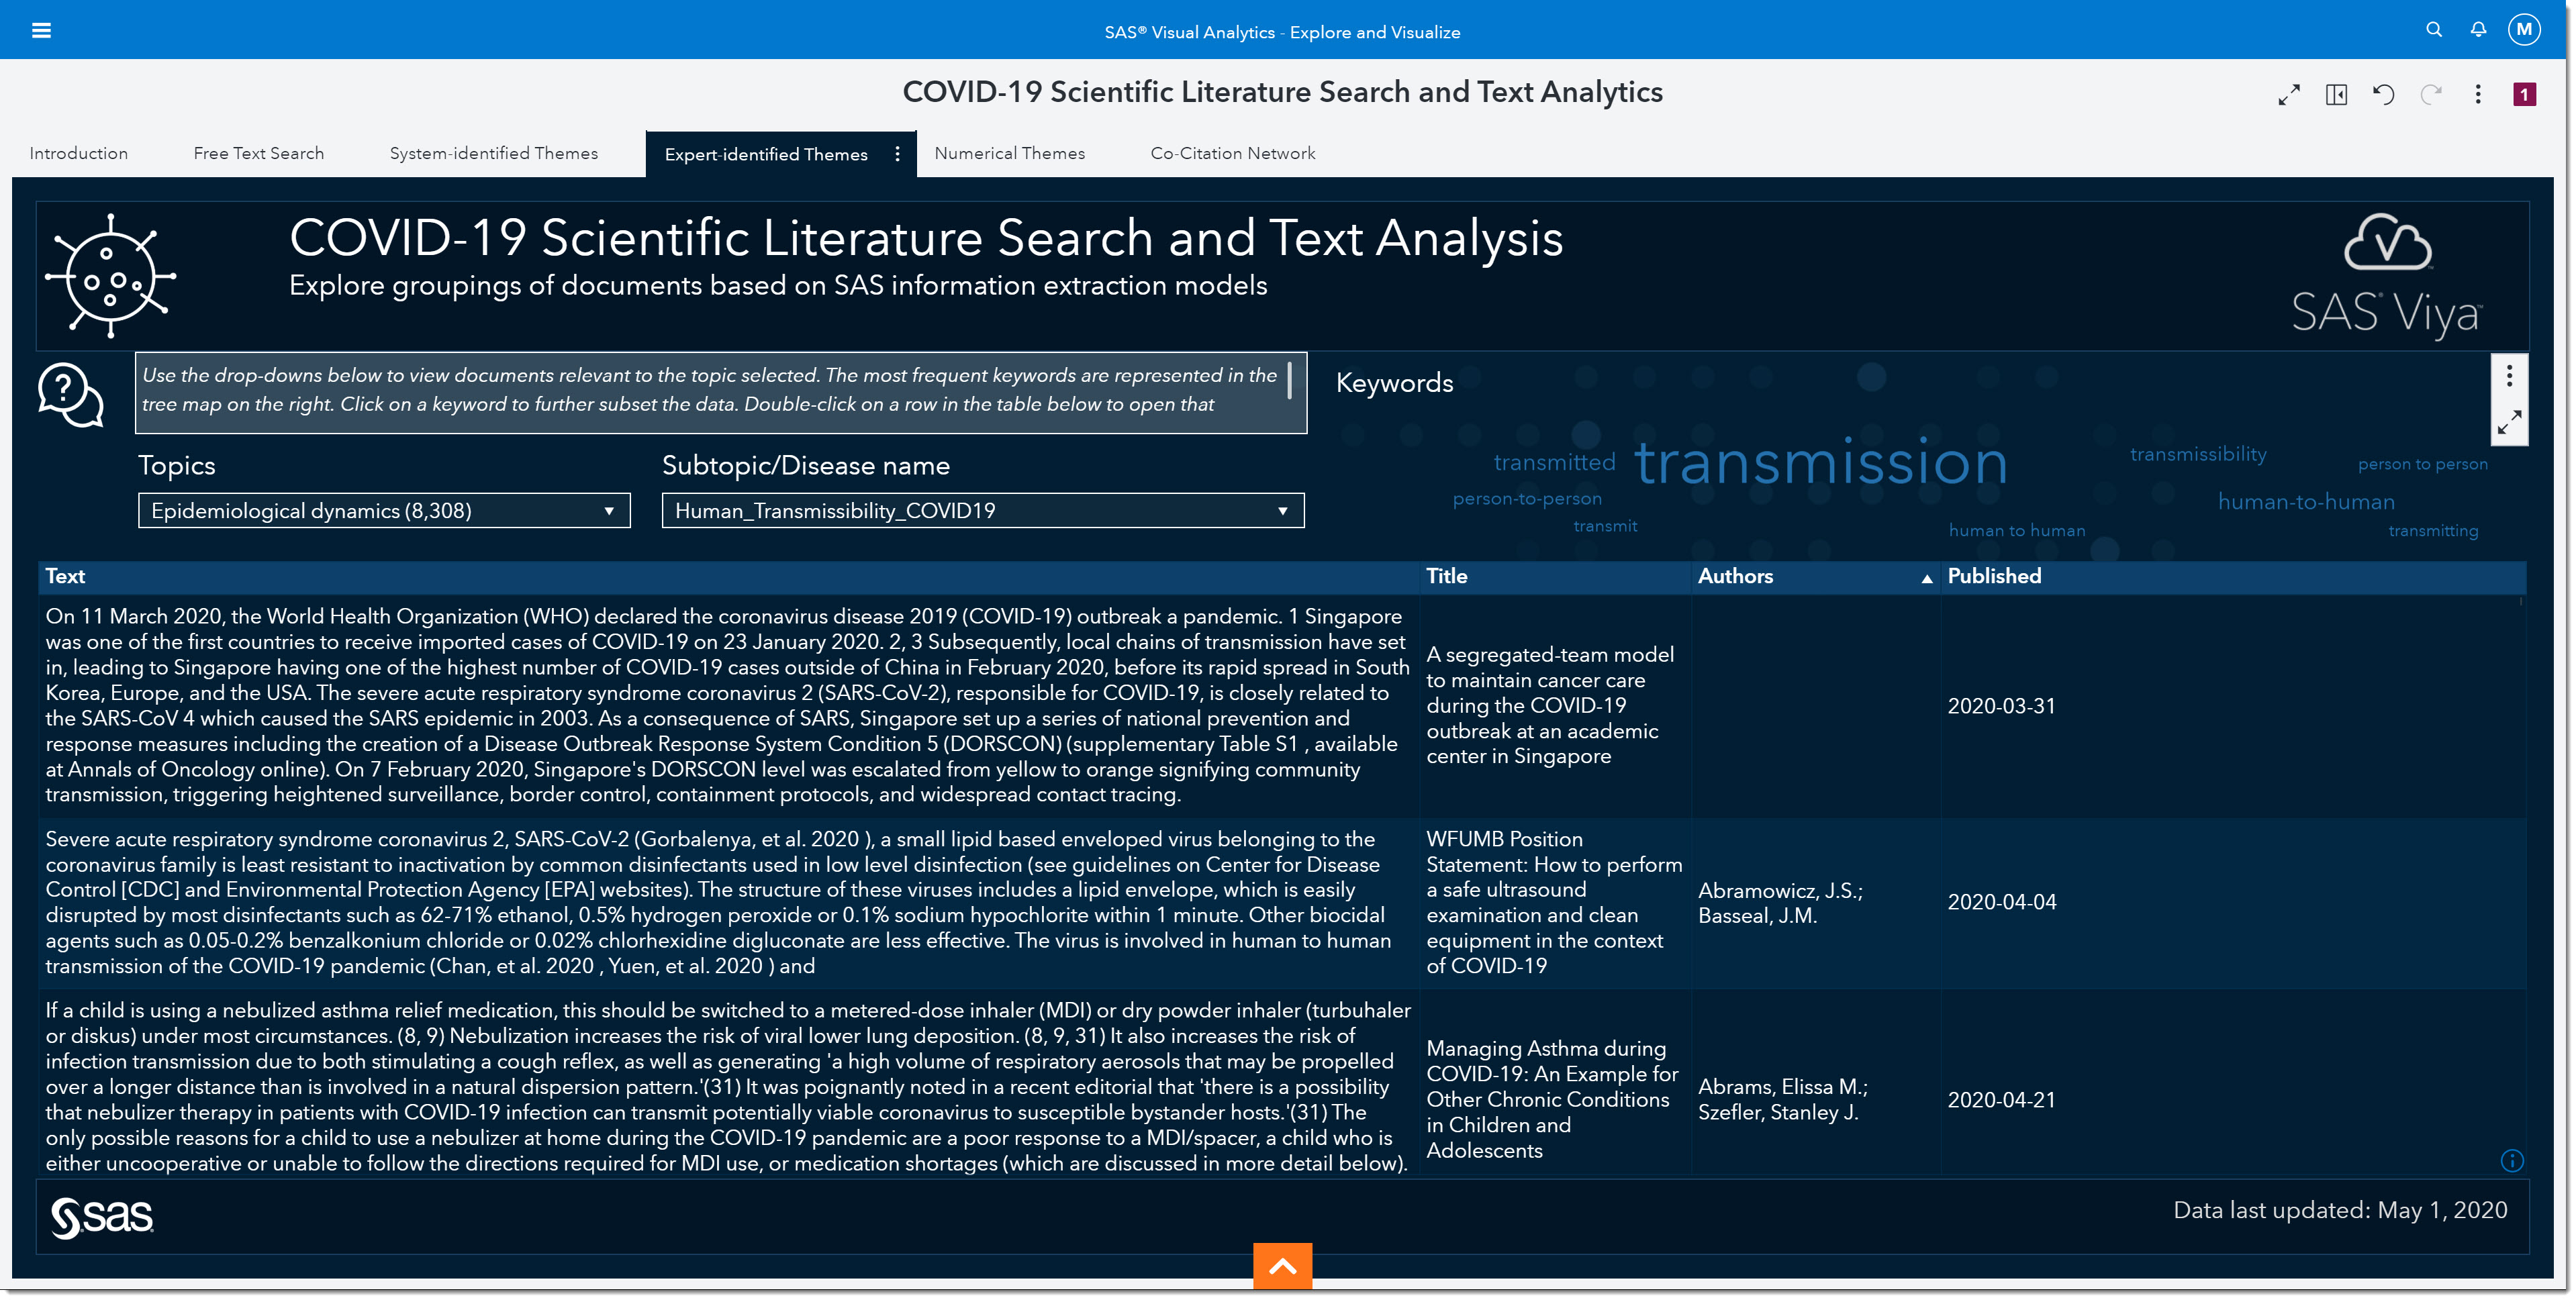
At the bottom, we can now quickly read through excerpts of articles that might provide more information on viral load. As we scroll through, we come across an article titled “Viral loads of SARS-CoV, MERS-CoV and SARS-CoV-2 in respiratory specimens. What have we learned? “ written by Al-Tawfiq, Jaffar A., published on March 13, 2020.
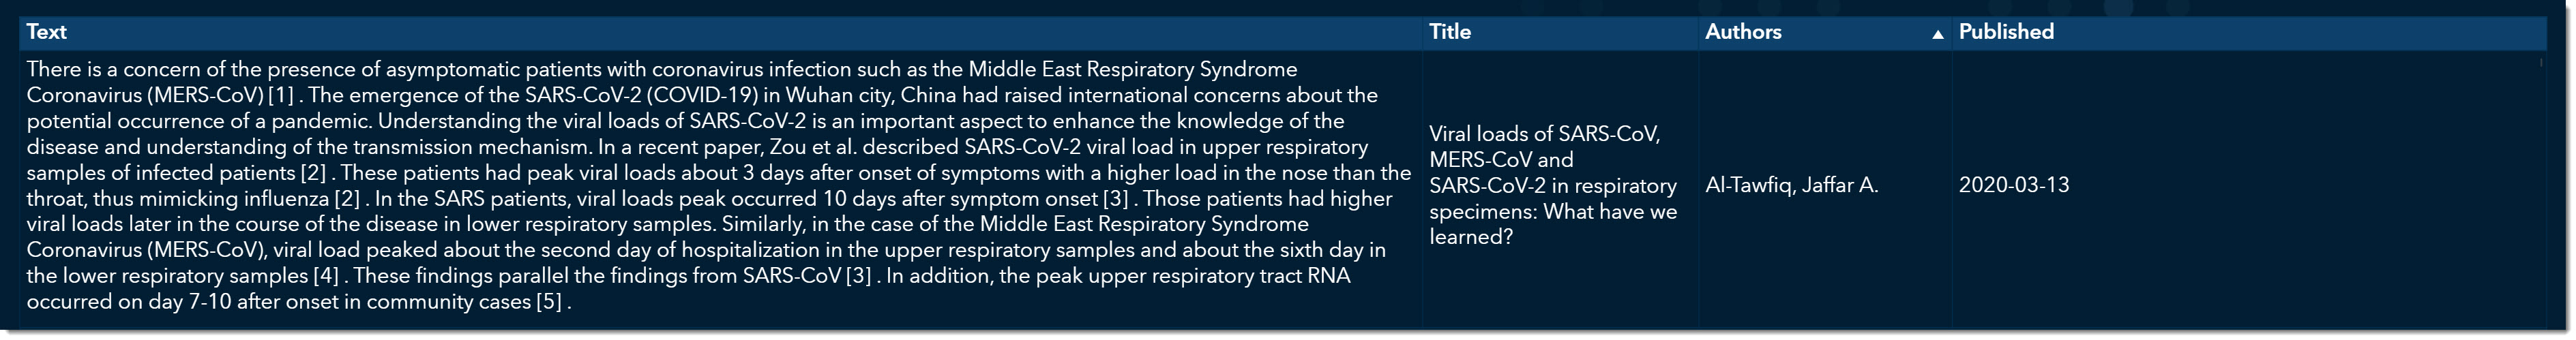
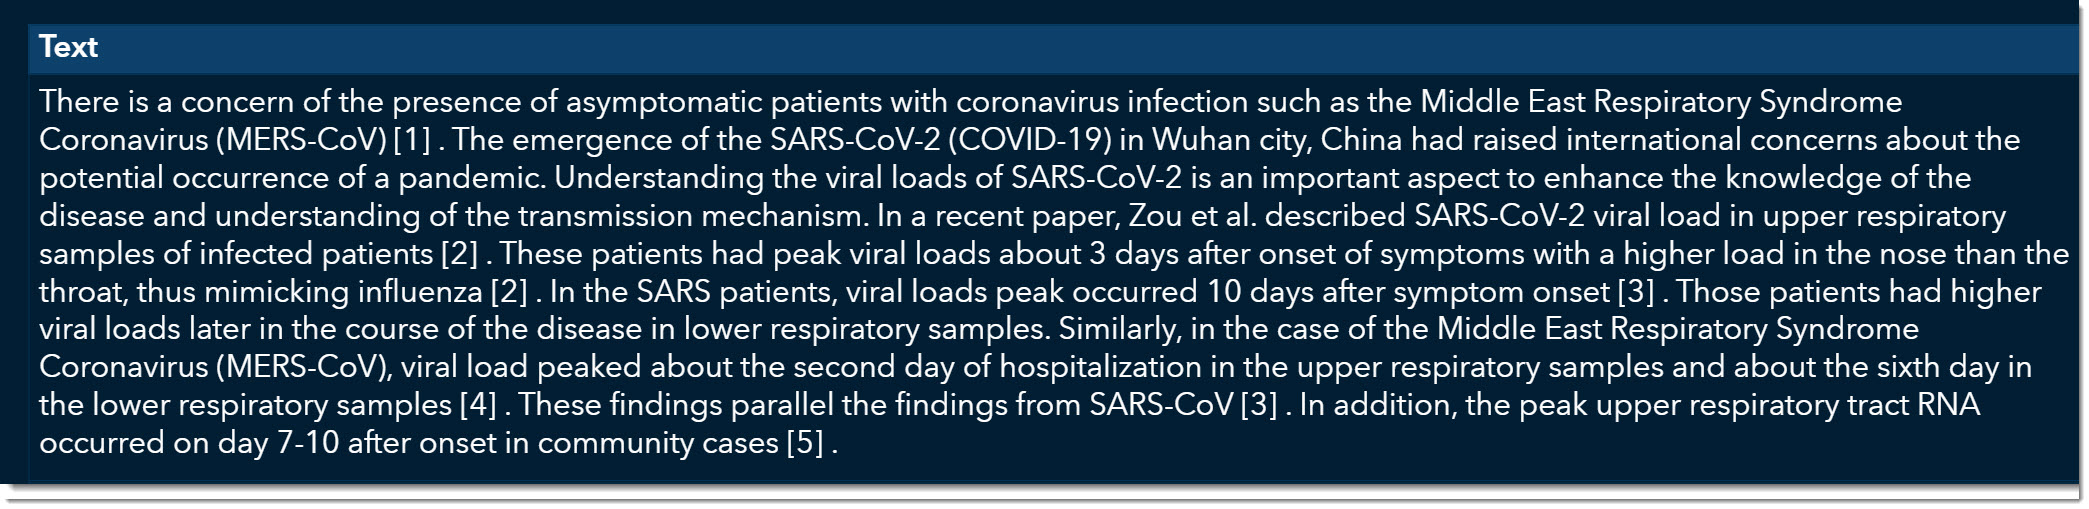
This is an excellent article that talks about how the viral load was much stronger for COVID-19 than its two predecessors, MERS and SARS. We can double click on this record and open the original article if we want to see all the details.
We’ve already learned about the transmissibility of the virus by looking at the numerical values. Now we have this information on viral load that paints a more complete picture of the impact COVID-19 might have. While this article came out in March and its information is probably well known by now, we can see that keeping an eye on these topics—as more and more research is published and as new waves of the disease might occur—can really help us navigate the negative impact and respond quickly to any changes. Furthermore, we didn’t have to spend countless hours reading through articles upon articles to pull information that pertains to our topic of interest.
Free Text Search:
So far, we’ve looked at some of the baseline metrics of this disease and learned that it is far more serious than other coronaviruses. What if we now want to learn more about peak values or hospital surge? As we’ve seen in the topics/subtopics, we don’t have a predefined topic to cover that information. In cases such as this, we can use the Free Text Search tab to search the literature for any term or combination of terms.
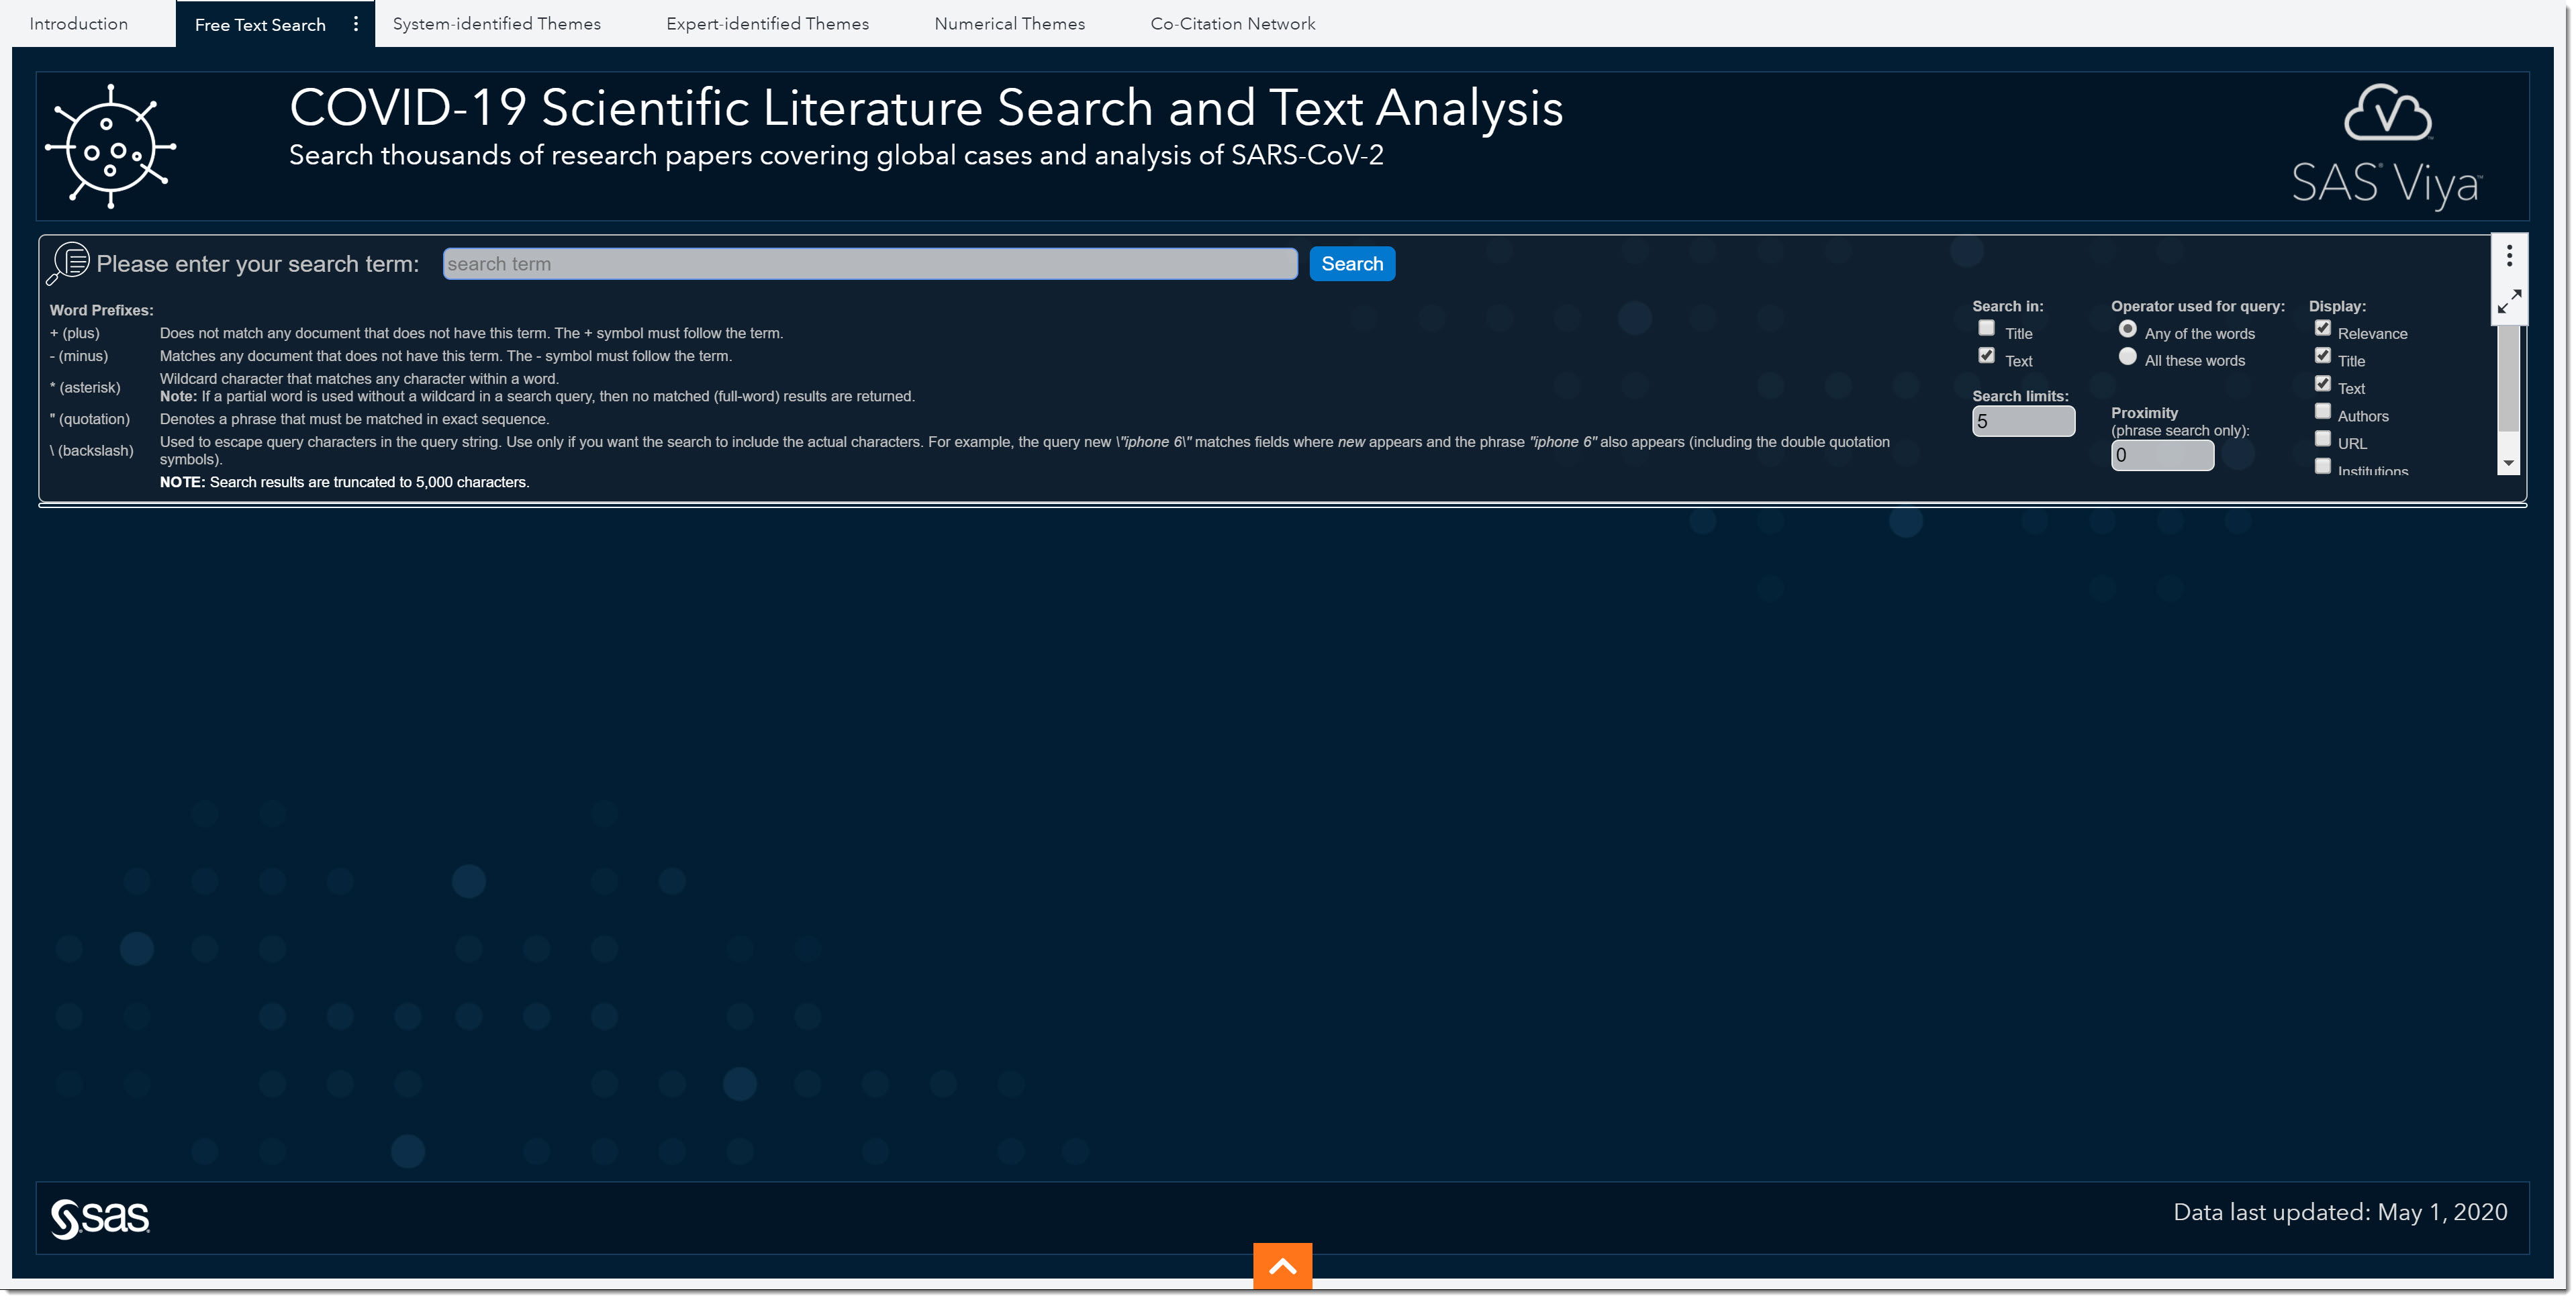
Notice the Word Prefixes that we could use when performing searches to go beyond typical Boolean expressions. There are a few different options to enhance our text query.
To the right of the search field, we see search parameters we can use—such as which data field to search, and whether the search should include any of the words we’ve typed or all of them. We can even choose the allowable distance between two or more terms. Lastly, we can select which columns to display.
![]()
Hospital Surge
Let’s go ahead and add Publish Time, Authors, and URL to the displayed columns. Remember in the Expert-identified Themes we didn’t have a topic for peak values or hospital surge. Let’s focus on hospital surge, and enter COVID-19 hospital surge in the search field, selecting All these words from the Operator used for query options.
We can scroll through the returned articles and find some relatively new, great planning guides for scarce hospital resources during the pandemic.
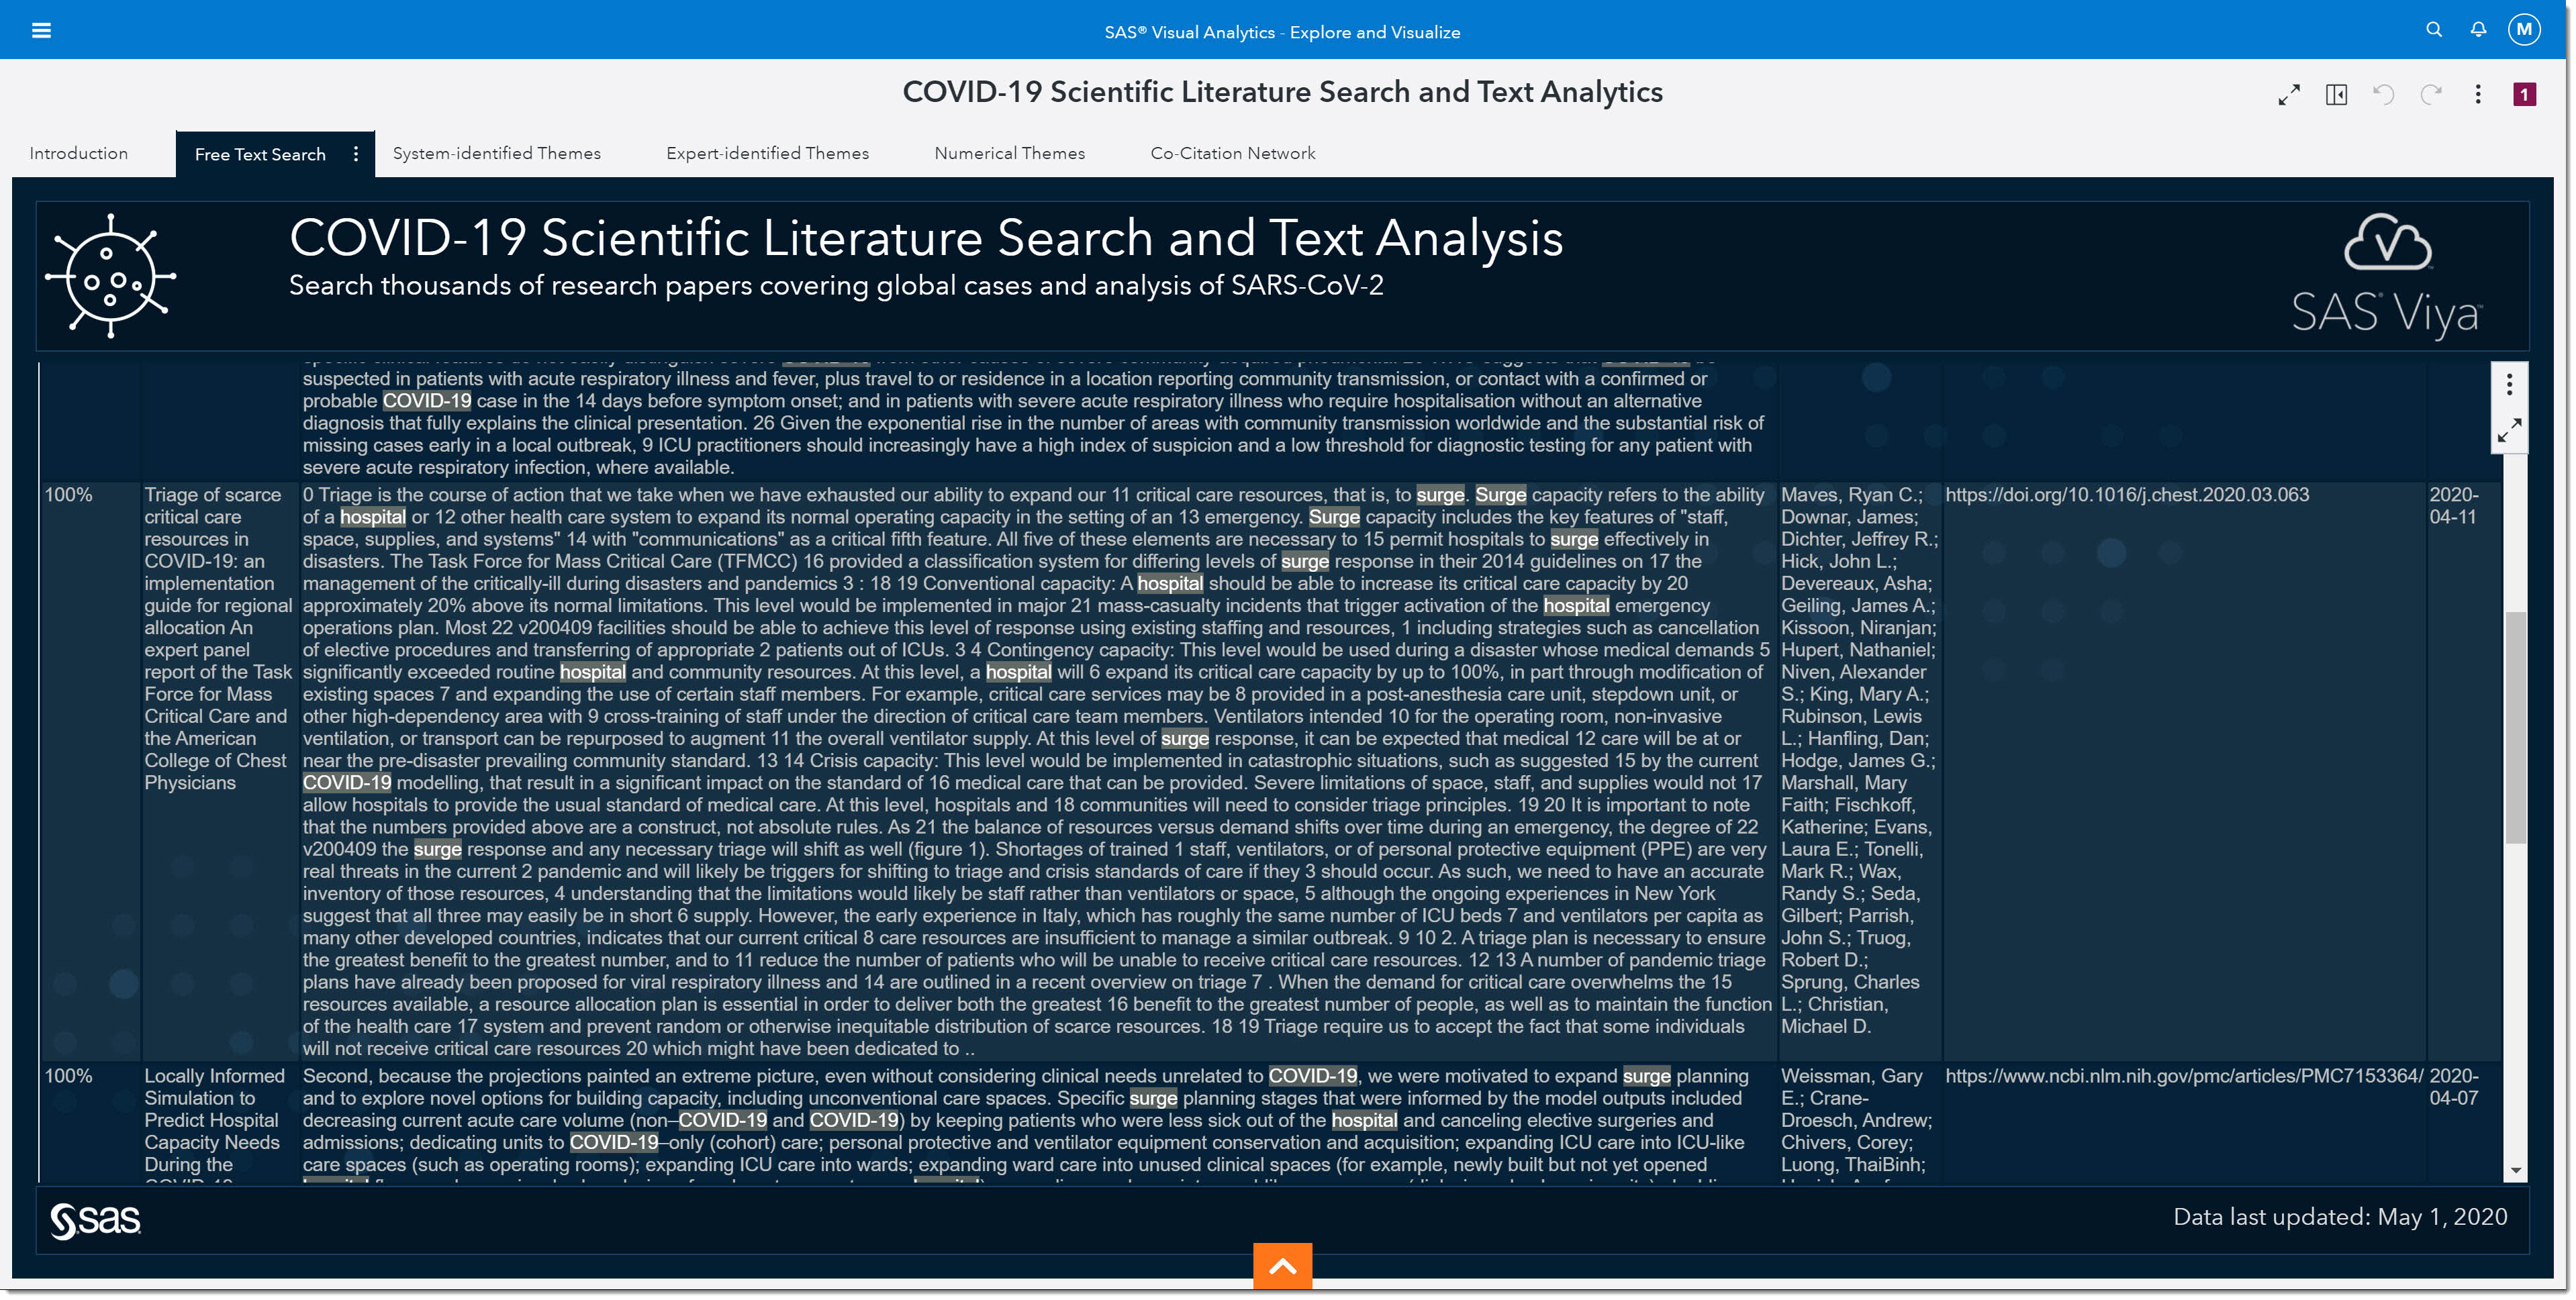
Once again, if we want to see the full article on any of these, we can double click on that record.
So far, we’ve searched the literature on various numerical attributes, looked at viral load using the expert identified themes, and used the free text search to look at some areas that weren’t necessarily captured yet by the models.
System-identified Themes
One area we haven’t quite investigated yet is treatment. There have been quite a few conversations around potential vaccine development and effective treatments. Another model-driven approach in this environment is system-generated themes. The System-identified Themes tab shows the topics that were automatically generated using unsupervised learning capabilities. Important terms that co-occur within documents are grouped together into topics. These topics are then used to categorize documents.
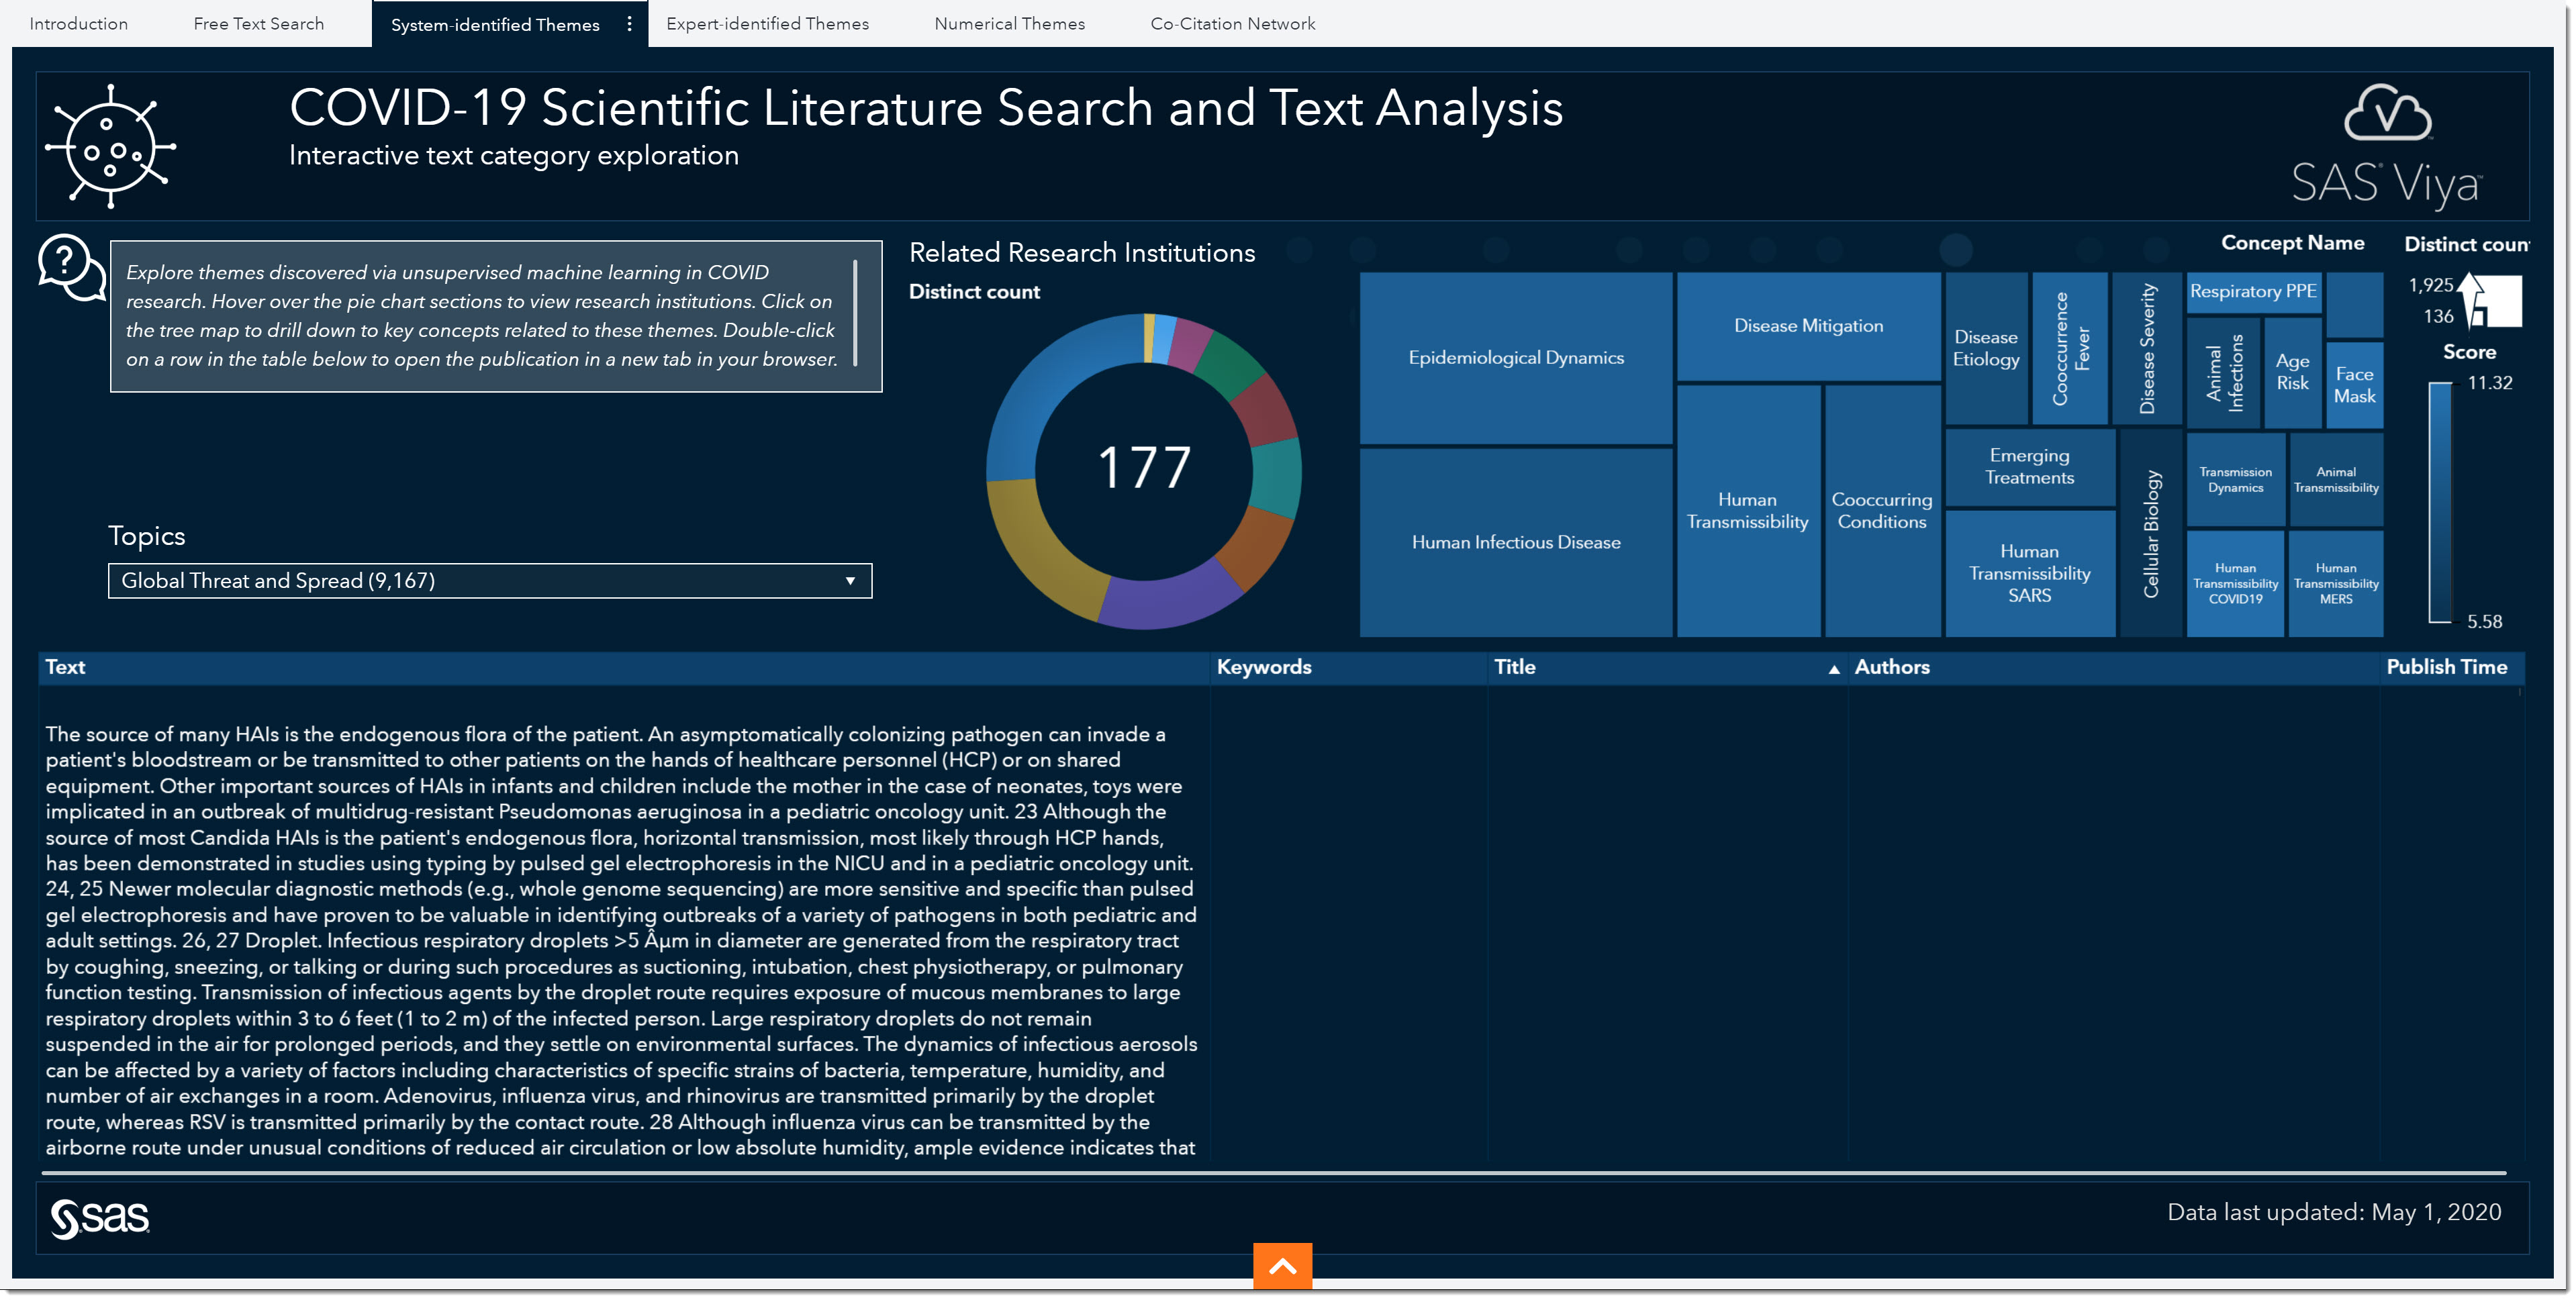
Just like in the Expert-Identified Themes tab, we have a variety of predefined topics here as well. Although this page doesn’t have the subtopics to filter by, we do have other filters such as related research institutions (pie chart) and key concepts or words (treemap).
Treatment
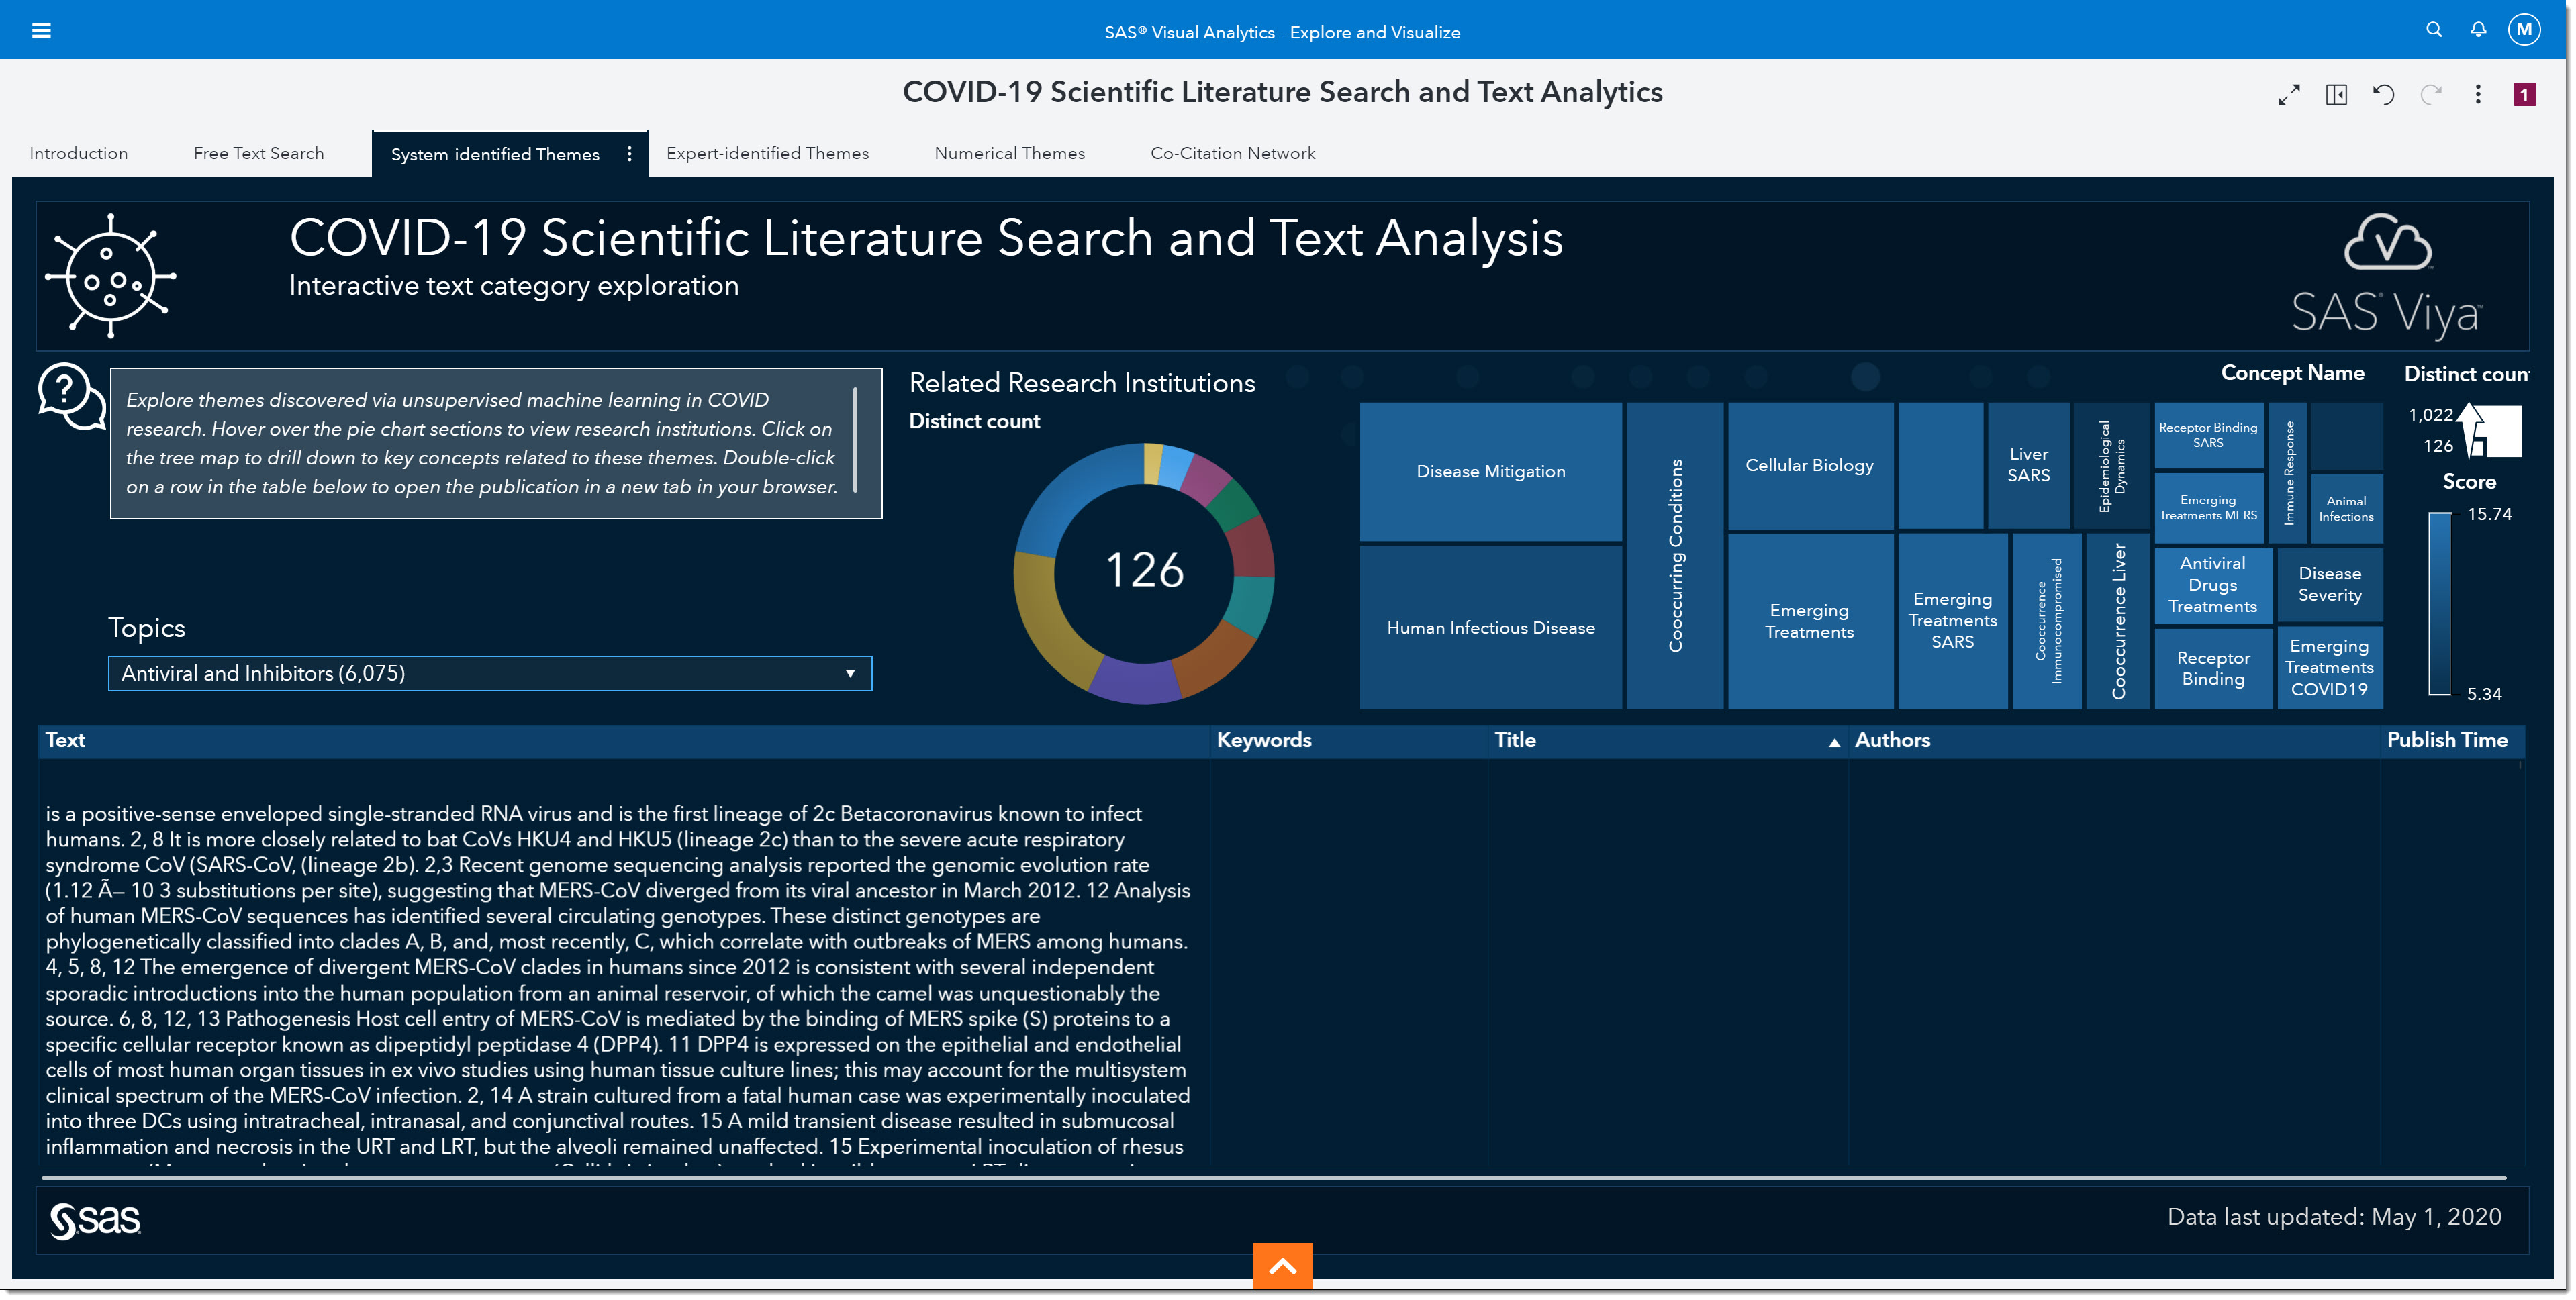
Since we are interested in understanding what treatments are being investigated, we will select Antiviral and Inhibitors from the topic dropdown.
Notice how the pie chart and treemap updated to reflect our selection.
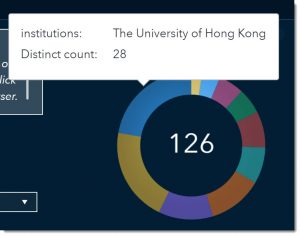
The pie chart answers the question “Which research institutions are providing articles on the topic of interest?” If we wanted to find scientific literature about antivirals and/or inhibitors produced by The University of Hong Kong, we could select that pie section and the rest of the page would be filtered based on that selection. But for now, we will leave all research institutions in our search.
Let’s look at the treemap of our key concepts. The larger the box the more prevalent that concept was in the literature. Disease Mitigation, Human Infectious Disease, and Emerging Treatments are the most common key concepts among the articles we’ve filtered.
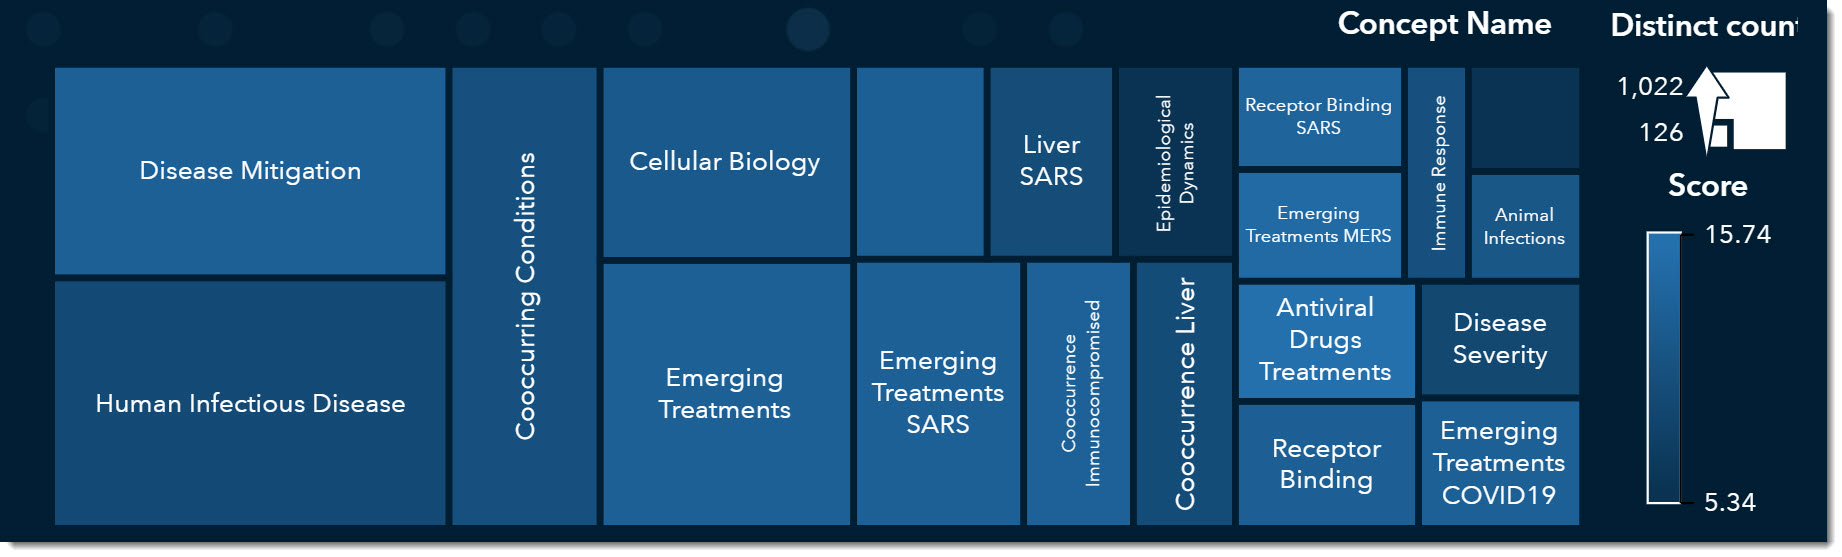
I’ll select Emerging Treatments and sort by Published Time (by clicking on the arrow to the right of the column name) so we can see the most recent paper first.
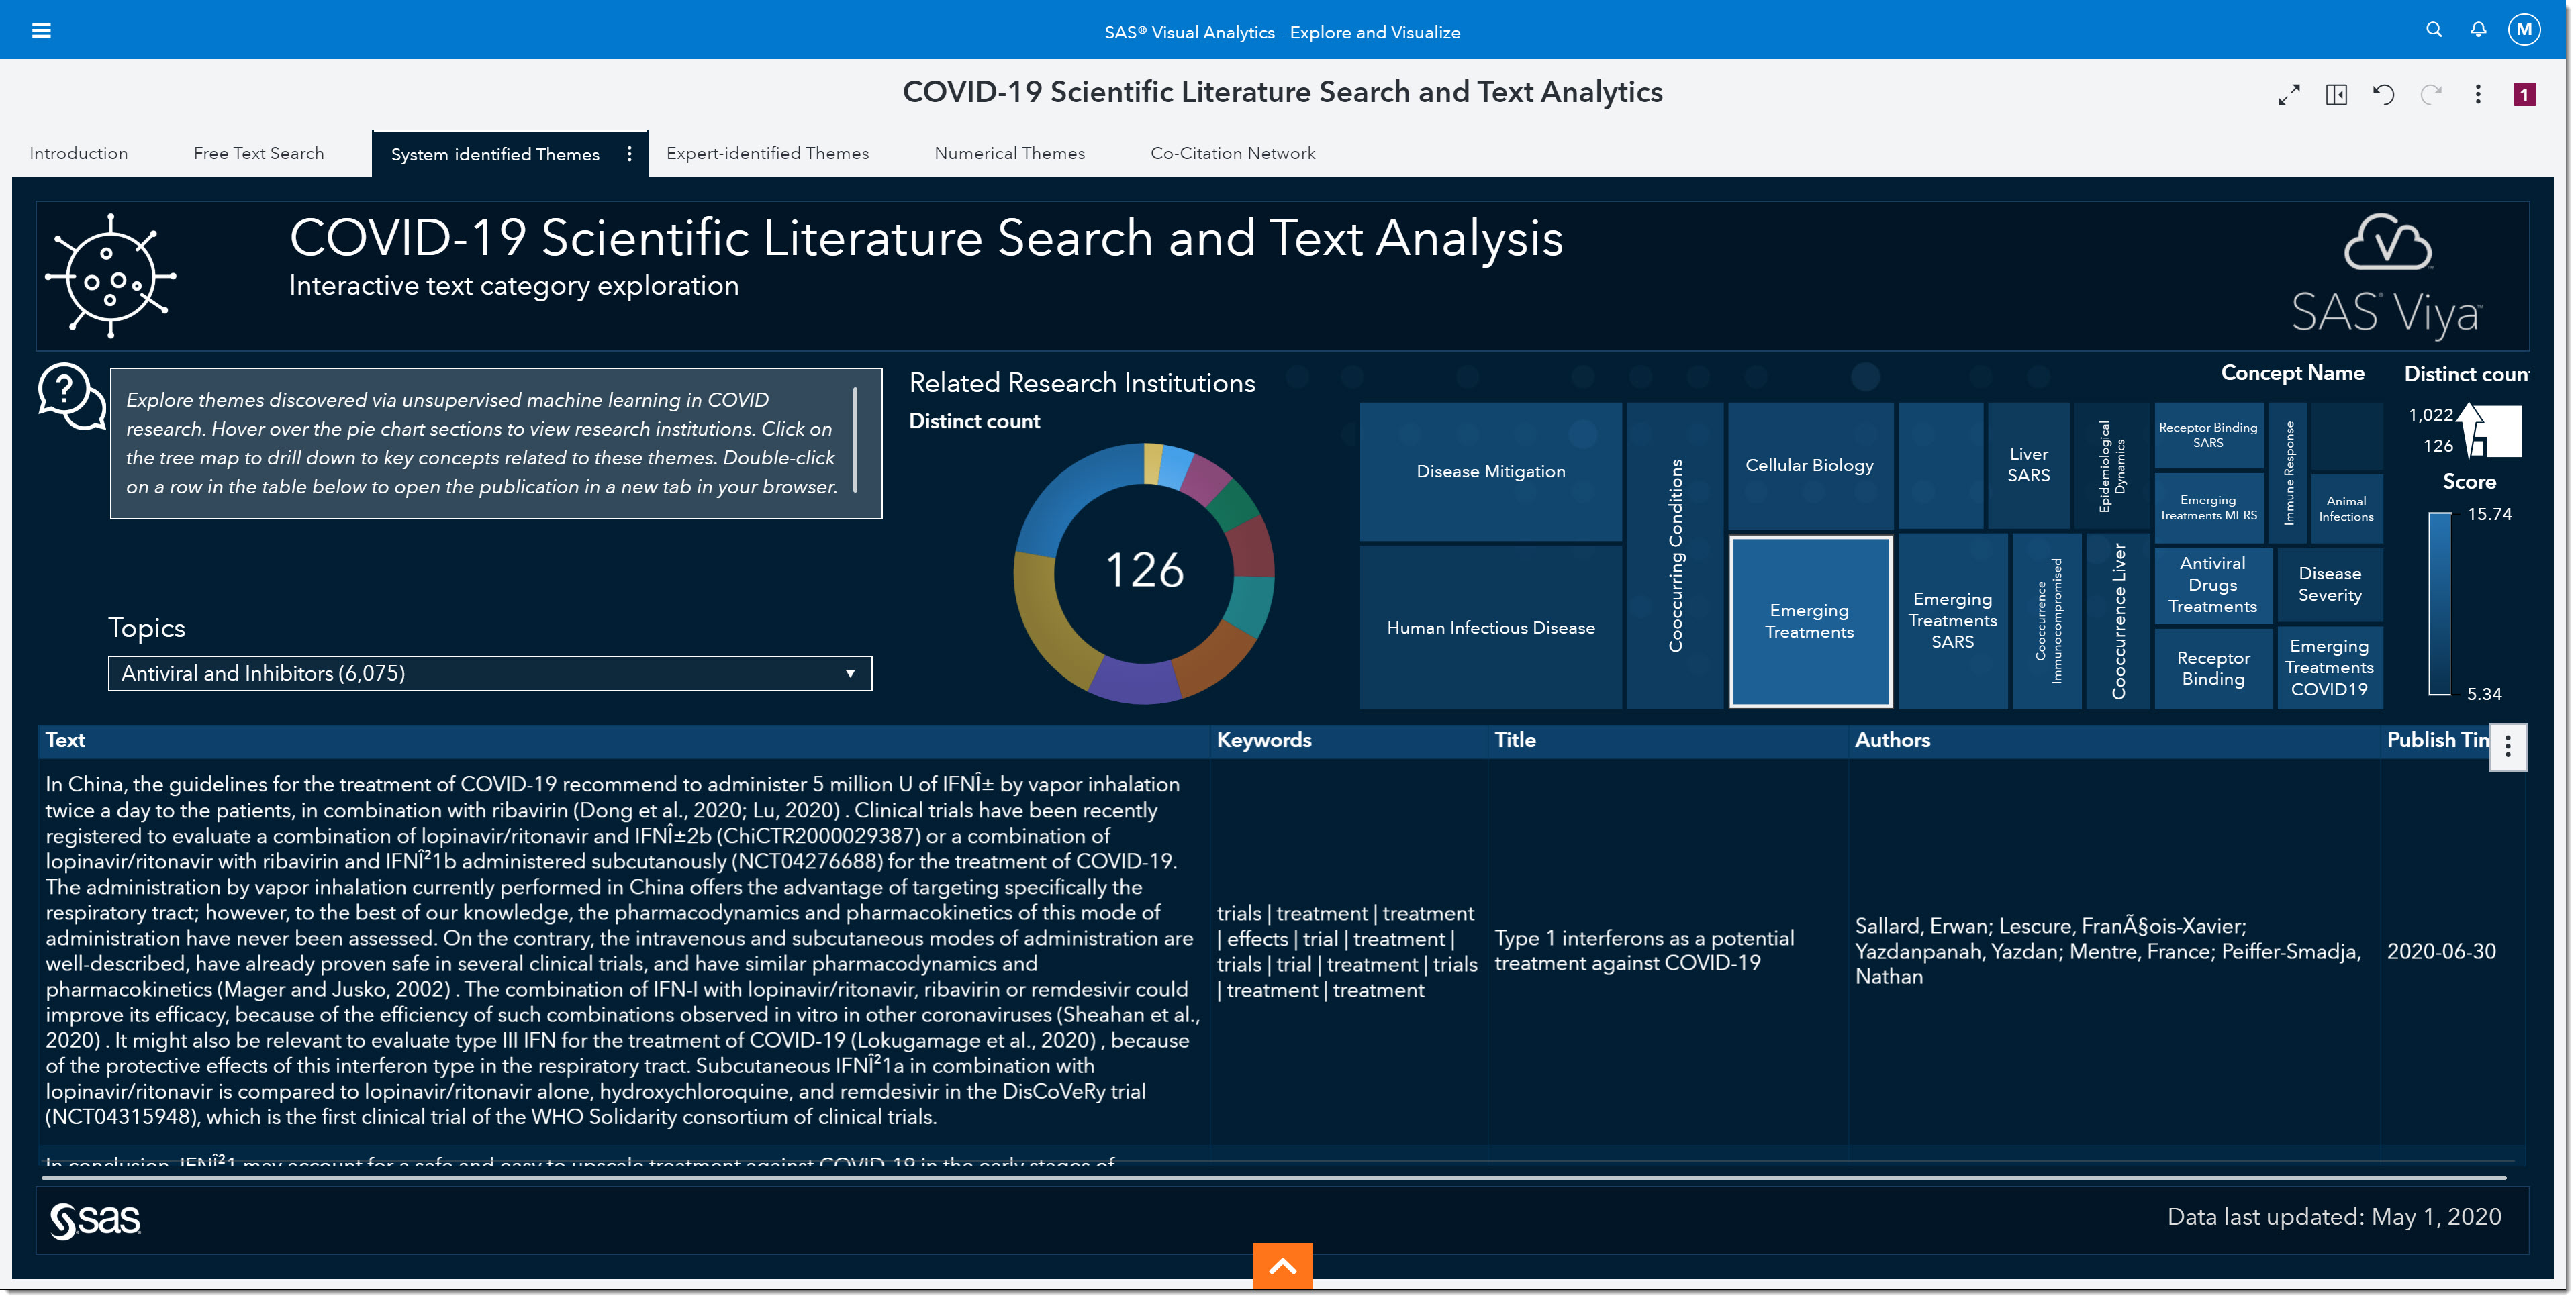
The first paper that comes up seems to have some promising information about the effectiveness of different interferons (a type of antiviral). It mentions some of the recent drugs we’ve heard about in the media such as ribavirin, remdesivir, and hydroxychloroquine. This paper might be one we look at in more detail. We can double click on it to open the actual article.
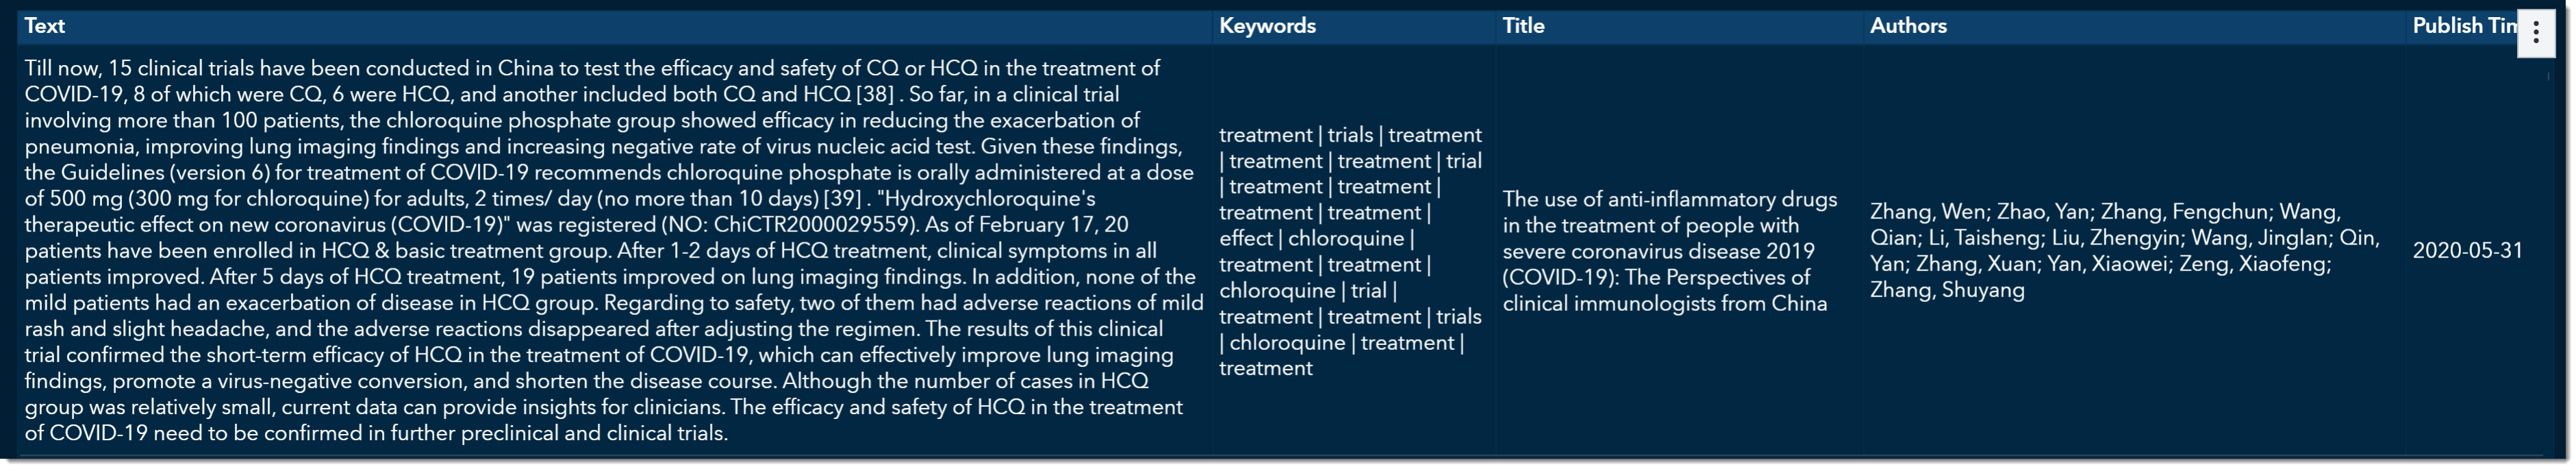
If we scroll a little further, we can find an article on chloroquine phosphate groups and its efficacy in reducing the exacerbation of pneumonia. This article would be another great choice for further exploration.
The COVID-19 Scientific Literature Search and Text Analysis environment provides many ways to ingest large volumes of data. Walking through the environment as epidemiologists, we’ve been able to quickly search 50,000+ scientific documents to find answers to key questions such as “What is the incubation period and how fast does it reproduce?" “How strong is the virus compared to other coronaviruses’ (viral load)?" “How can we best prepare for hospital surges of limited resources?” and “What types of treatments have shown efficacy?"
Looking back, we can see how this information would have been useful at the time these articles were published, and now we can use these models to help identify new research and how to respond best if a new wave of the virus occurs. We need to be diligent in our efforts to stay on top of new research and viral changes.
Co-Citations Network
Our final tab in the environment is the Co-Citations Network. As epidemiologists, we would be interested in understanding the authoritativeness of an article. The higher the authoritativeness is, the greater the likelihood that the resource is a seminal work on a particular topic.
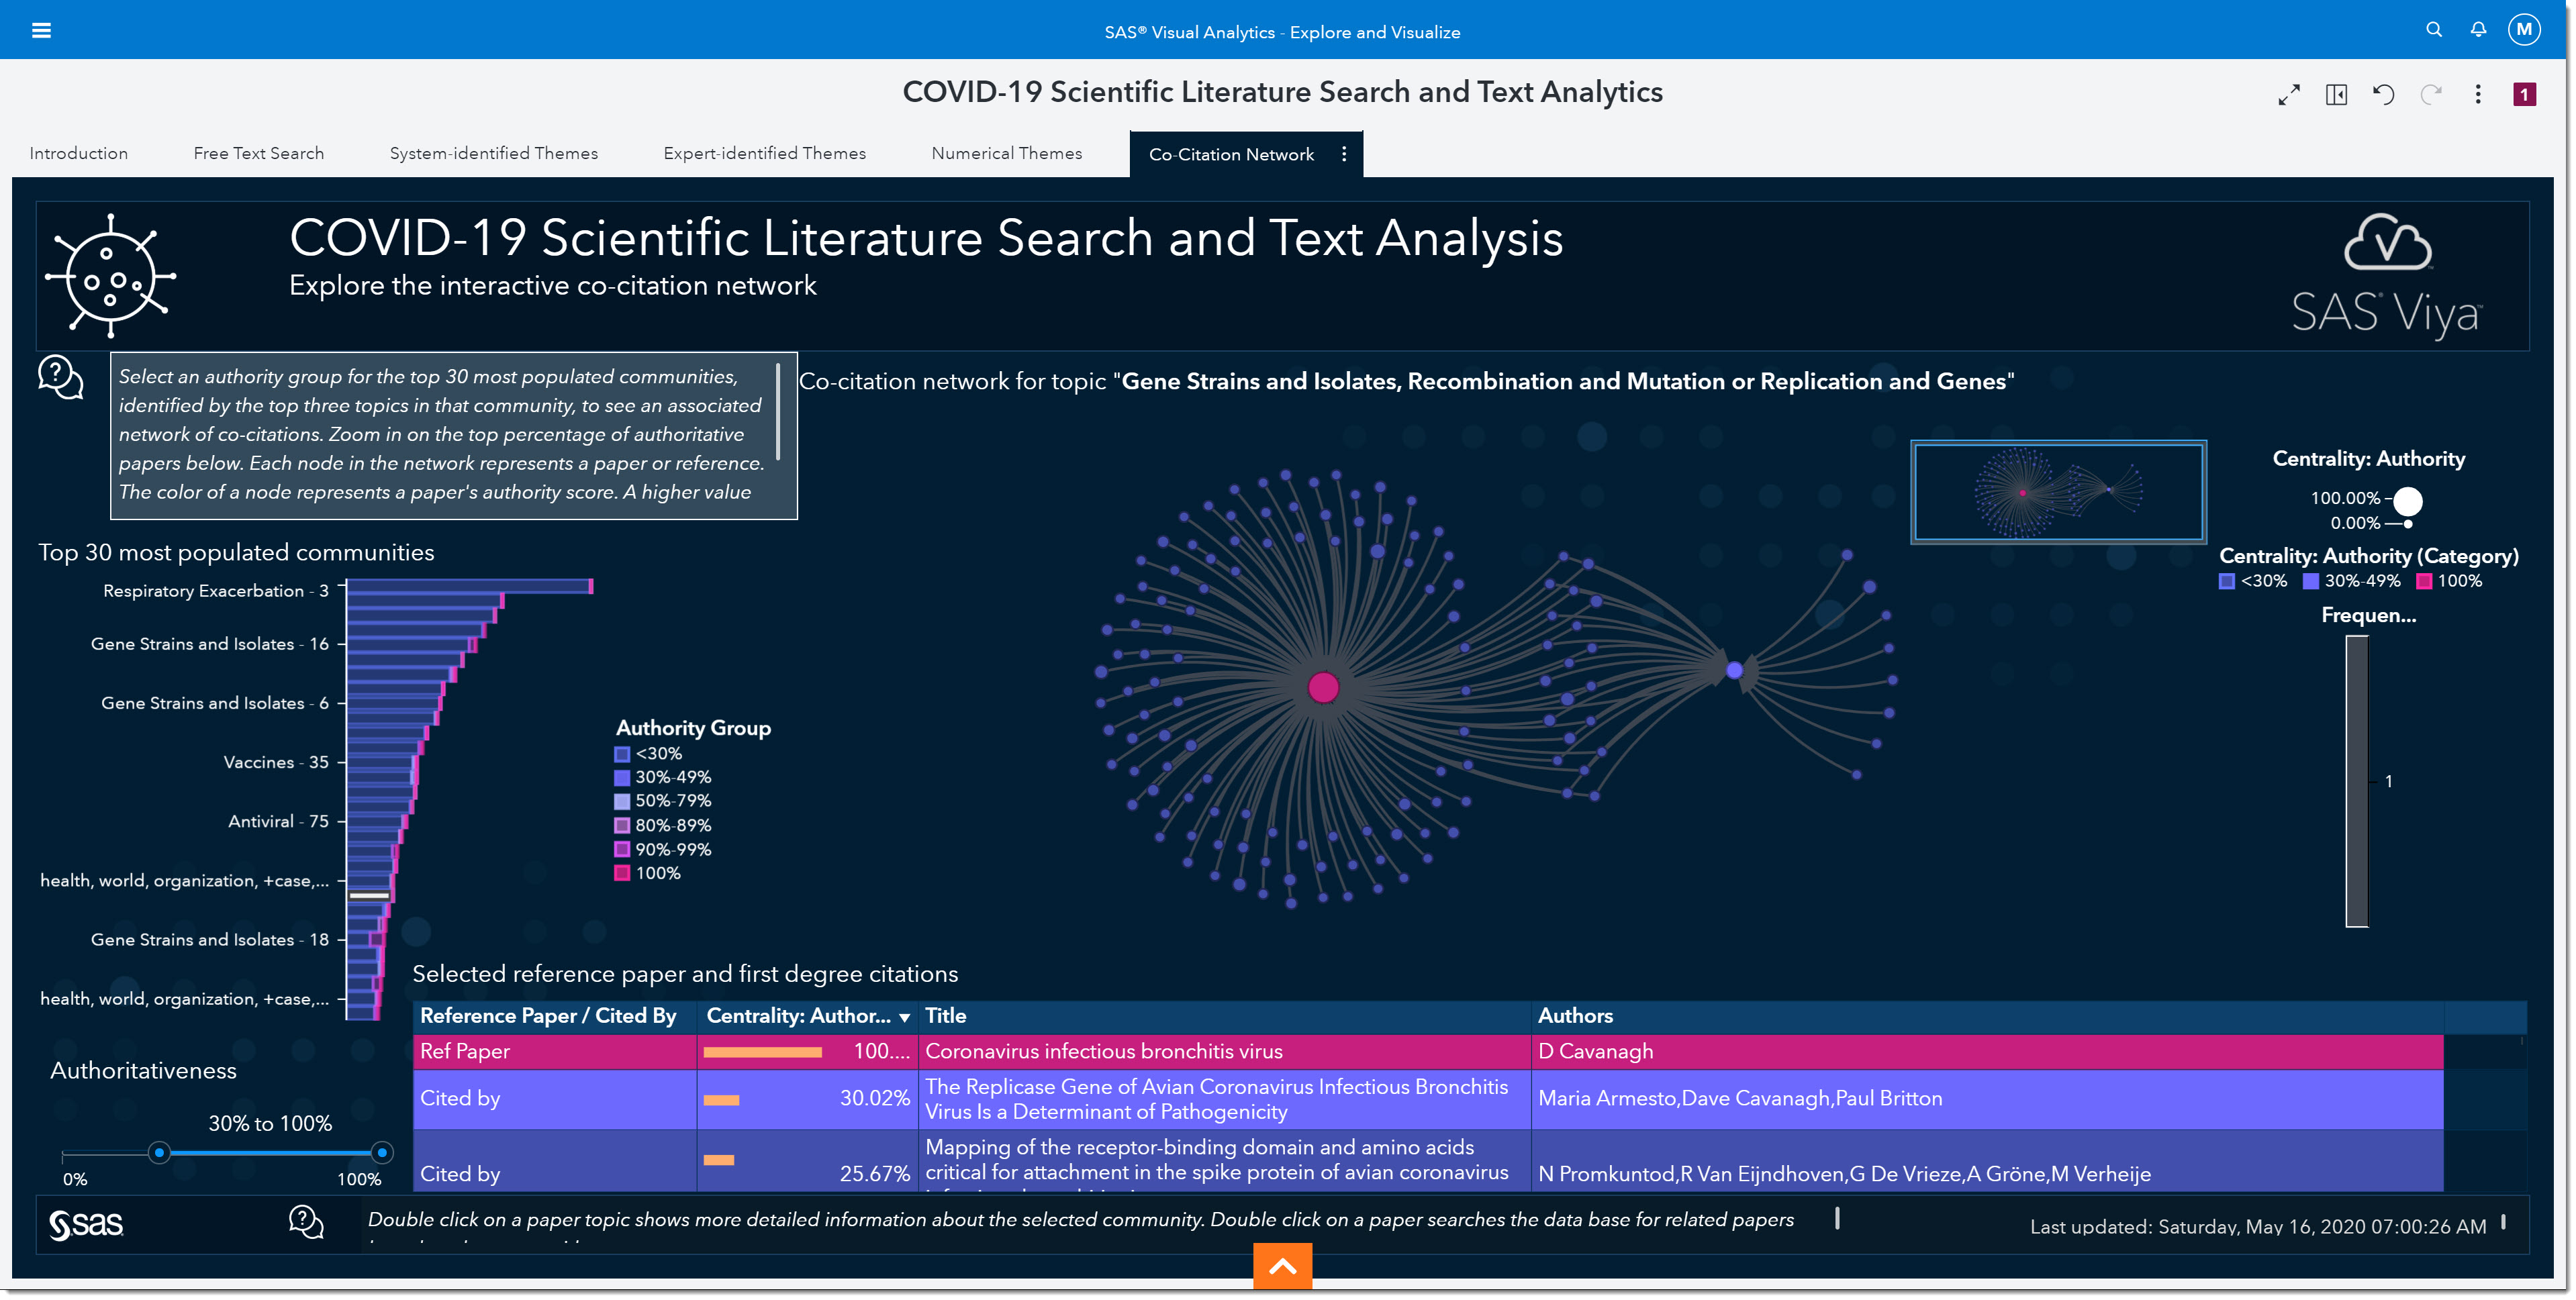
In the middle of the page, we see a network of co-citations—where each dot in this network represents a reference in a document. The larger the dot is, the more authoritative that reference is. We can control the number of citations shown in the network by changing the authoritativeness slider on the bottom left of the page. Authoritativeness is a measure of centrality within the network, calculated using eigenvector calculations. Clicking any dot in the network populates the table below with information about that publication, as well as the publications that cite it. This allows us to focus on a subset of publications in that community.
The COVID-19 Scientific Literature Search and Text Analysis environment provides value to anyone who needs to:
- Search through the vast amounts of scientific literature to find answers to key questions about COVID-19.
- Track any changes that might come about with changes in the virus and its spread.
- Track changes to our responses such as treatments, vaccines, and surges on limited resources.
This environment assists the medical research community, government epidemiologists, first responders, and health care providers to survey relevant research, find needles in haystacks, and be able to extract insights more efficiently. We hope you will find it invaluable in aiding your COVID-19 research.
Access the free environment to do your own analysisRead more about the COVID-19 Scientific Literature Search and Text Analysis environment.

3 Comments
Hello Melanie,
Great article.
I have a query regarding COVID-19 impact on business. Do you think Digital Transformation, Digital Marketing and eCommerce will increase due to this pandemic and the brands who are yet not deciding on a move to Digital Platforms will take faster decisions?
COVID-19 has put a strain on our economy in terms of customer acquisition, interactions, and experiences. Customers have adapted and, now more than ever, engage with brands through multiple digital touchpoints (e.g. social, web, mobile, call center, etc). Companies that are more flexible and agile in adapting to the new reality have an advantage. Adoption and use of a core set of digital transformation-related technologies (eg. Cloud, analytics, digital marketing) will increase as companies try to better understand their current situation and needs. They will have to use data from diverse, real-time sources to personalize digital engagements and improve service at all levels and across all channels.
Thanks for the detailed answer Melanie