As a resident of Northern California, I was interested in learning more about the causes of wildfires. My area has recently experienced large fires that caused many residents to evacuate their homes and some who have even lost their lives.
Last October there were more than 170 fires that burned over 245,000 acres in Northern California alone. According to The Sacramento Bee, Cal Fire has alleged that trees around power lines sparked three wildfires in Butte and Nevada Counties in October. These fires destroyed 60 structures, burned close to 1,000 acres of land and caused many residents to evacuate their homes.
What are the main causes of Wildfires? And how can I make sure I keep my home and family safe?
To help answer these questions I decided to use SAS® Visual Analytics to perform data discovery on wildfire data downloaded from United States Department of Agriculture. This data contains data on wildfires that have occurred in the United States from 1992 to 2015. It contains 1.88 million wildfire records that occurred over 24 years and have burned approximately 140 million acres.
Exploring wildfire data
The first thing I do when looking at a new data set is get a basic understanding of the data. I wanted to see general information about number of fires, top ten causes of fires and fire size by state. At the top of my report, I also added a slider for the date in case I wanted to investigate changes over time.
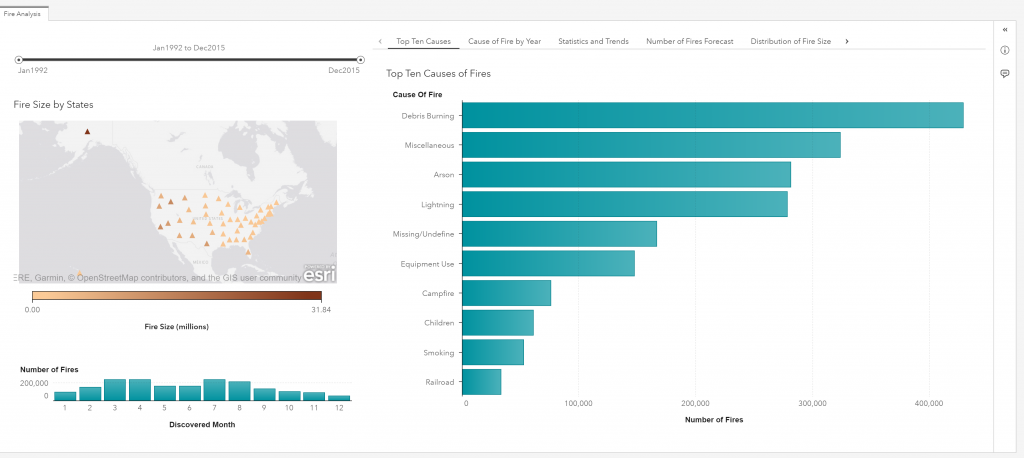
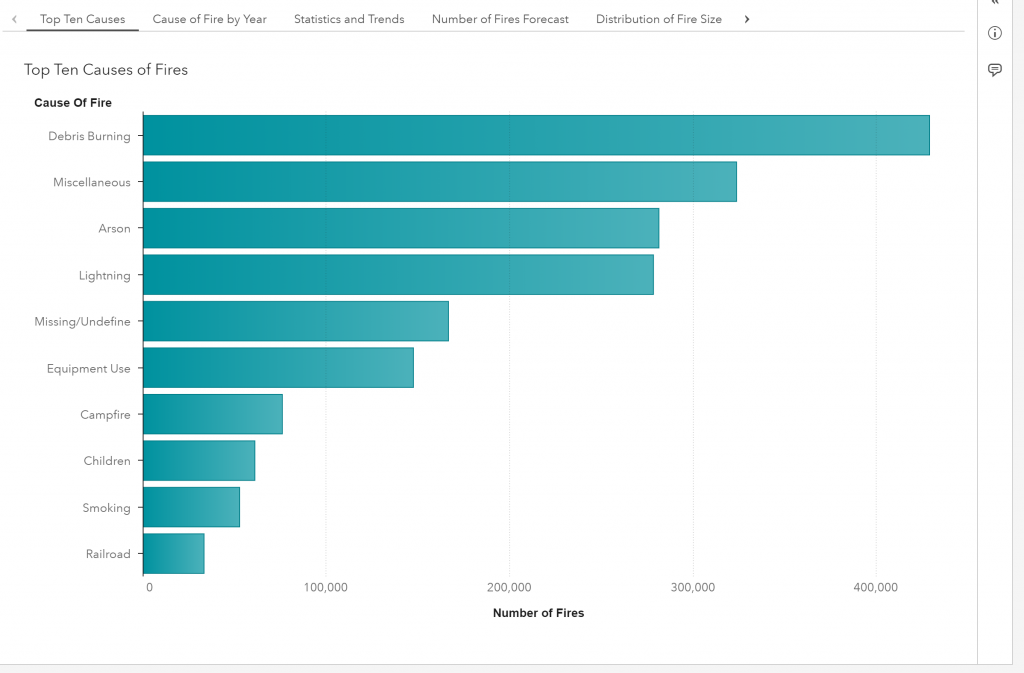
Looking at my Top Ten Causes of Fires bar chart, I can quickly see that debris burning causes more wildfires than other causes. I find it surprising that arson is the third highest cause of wildfires. I hadn’t realized that arson was that prevalent.
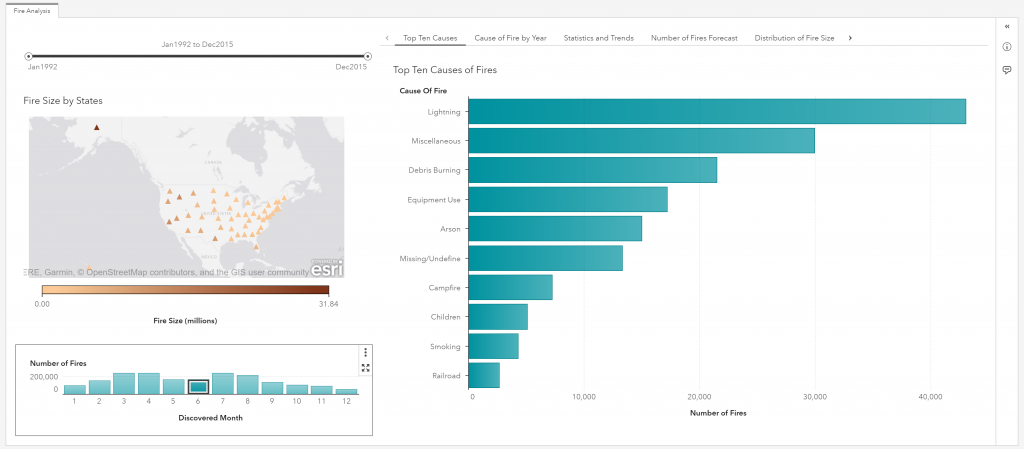
The bar chart showing the Number of Fires tells me that March, April, July and August are busy months for fire departments.

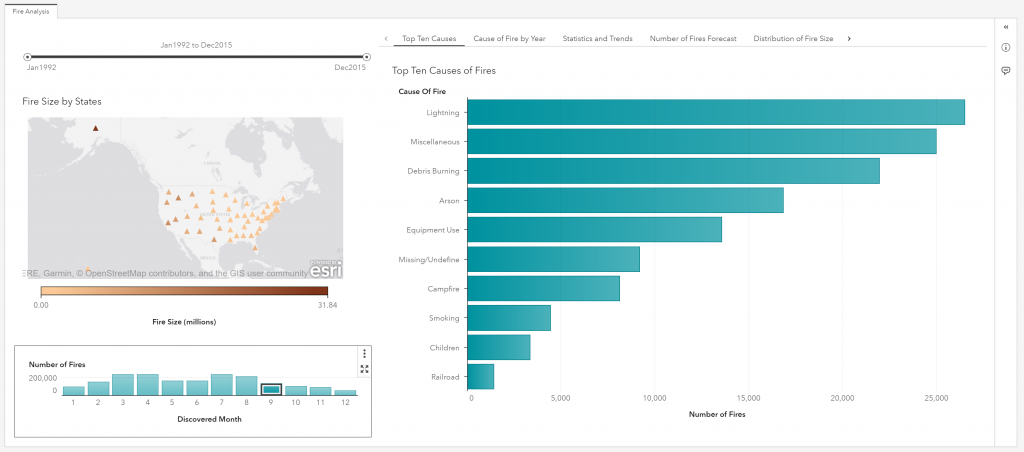
The two bar charts are linked, so as I click on each individual bar in the Number of Fires bar chart, I can see what the top ten causes of fires where for each month. From June through September, lightening becomes the highest cause of fires.
Knowing the number of fires is important, but now I want to look at how much land was destroyed by the fires and see which states have the most damage. Looking at the chart, Fire Size by States, I can see that Alaska, California, Idaho and Texas had the most land damage by wildfires.
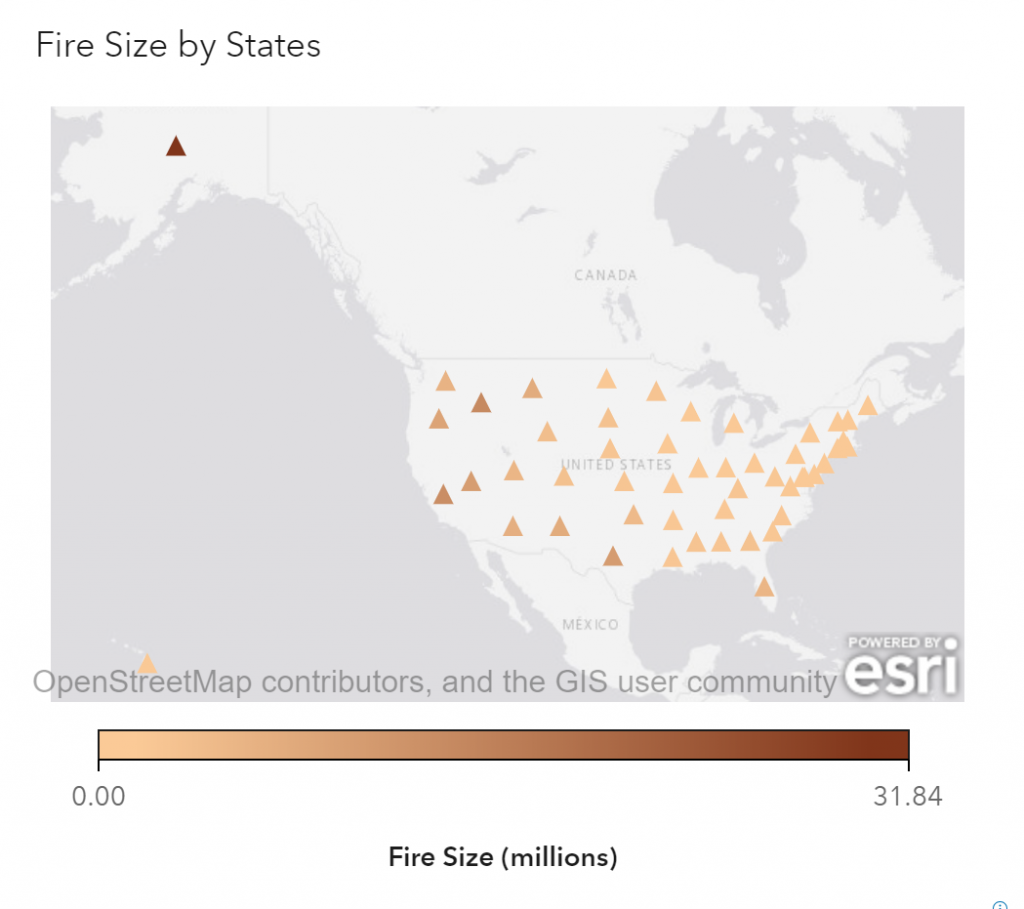
This Fire Size by States chart is linked to the bar charts. So, when I select Alaska, I can see that Alasaka’s wildfires are mainly caused by lightening, followed by debris burning then campfires. I can also see that most of the fires occurred in May through July.
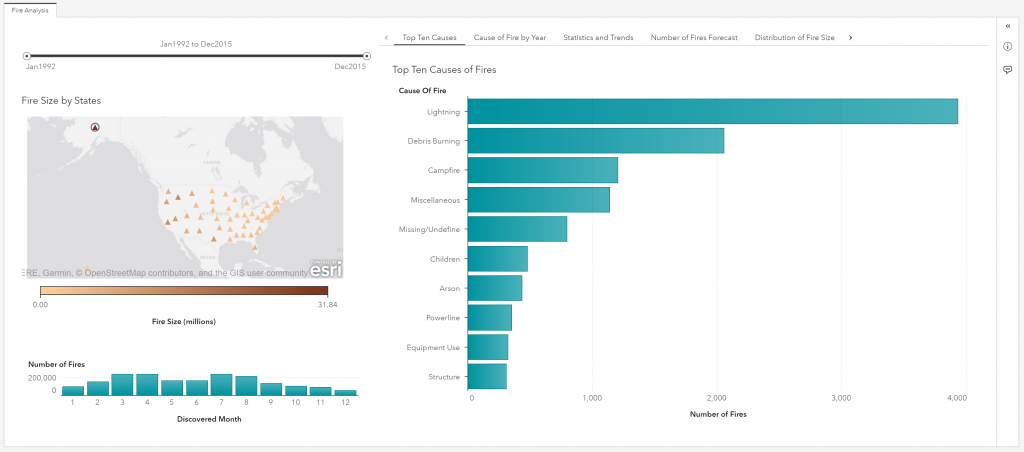
Let’s see what happens when I select California. Selecting California, shows me that miscellaneous, equipment use and lightning are the highest causes of wildfires here in California. July seems to be the month where most fires are started.
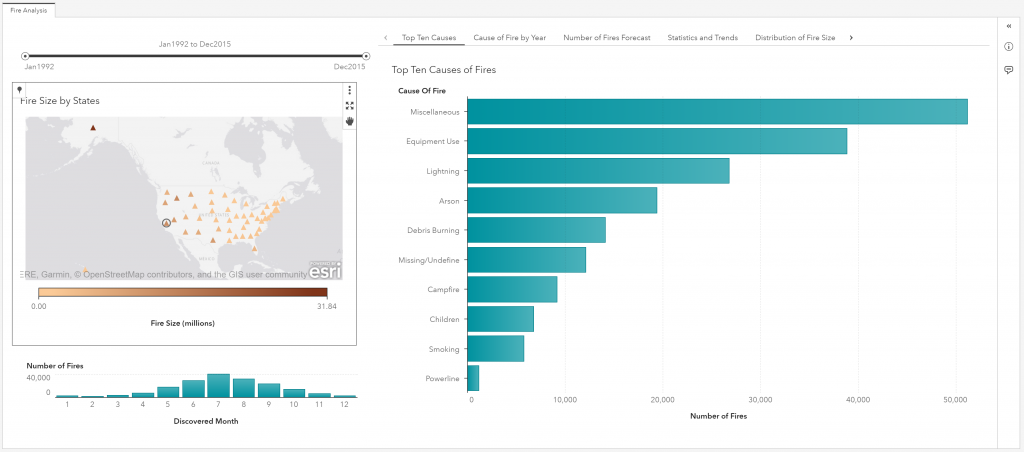
Next, I’d like to see a snapshot of the causes of wildfires over time. Have certain causes of wildfires dropped off or have they increased? I’ll use a heatmap that is filtered off my Fire Size by States geo-chart so that I am only seeing the data for California.
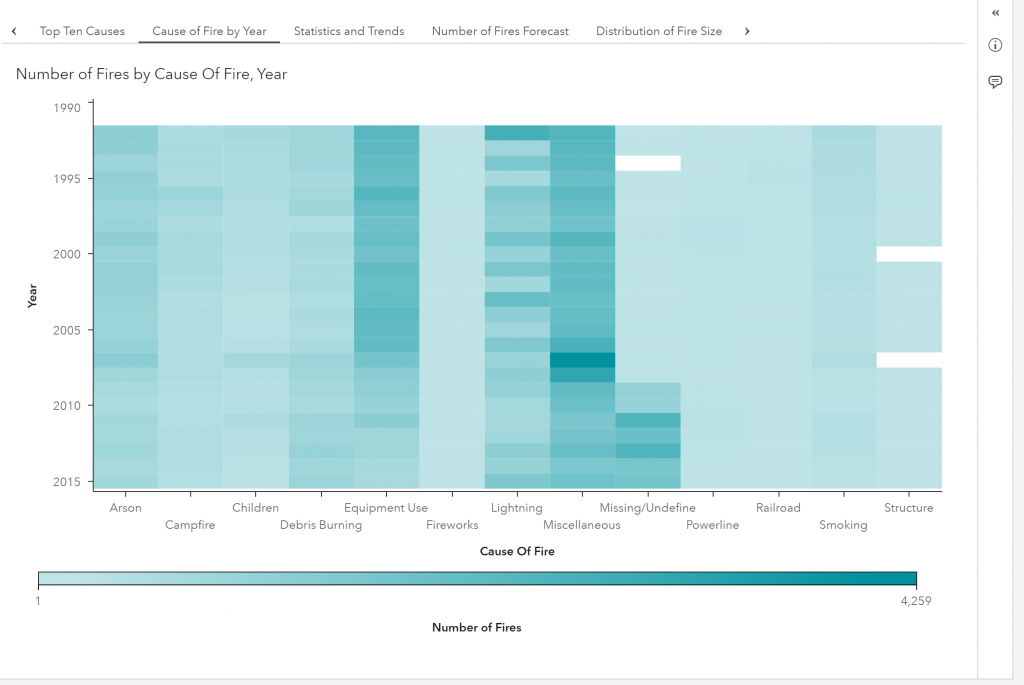
This chart shows me that equipment use as a cause of fires has dropped off in the last few years. Let’s look into some more statistics and trending data for California to see if that is truly the case.
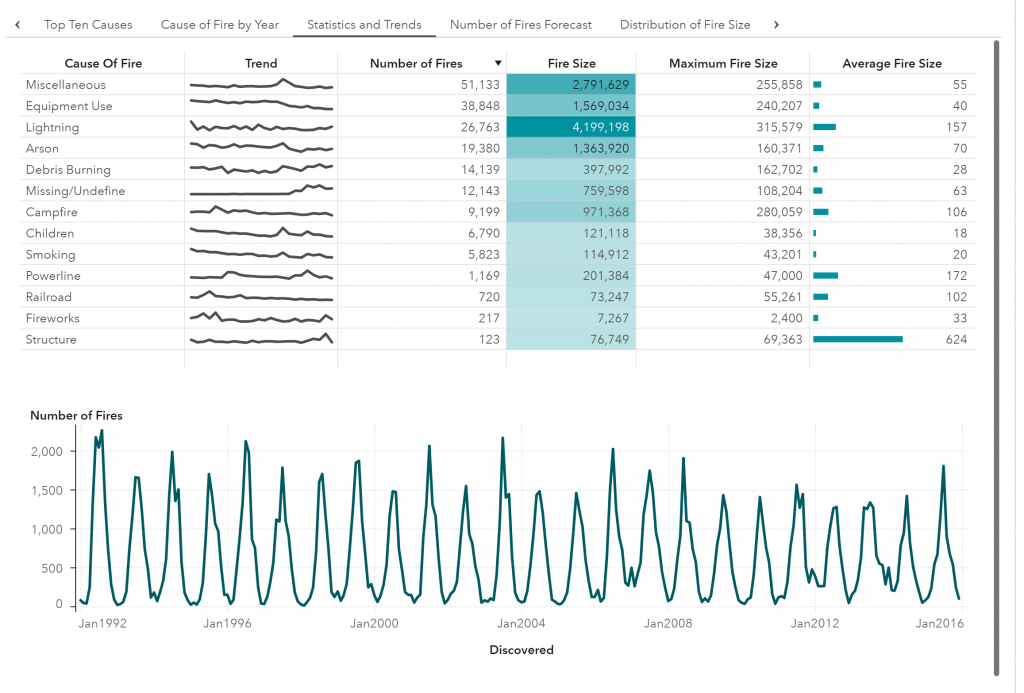
Here we can see by the trend line that the number of fires caused by equipment use has dropped. If we select equipment use in the table, the line chart below will show the details.
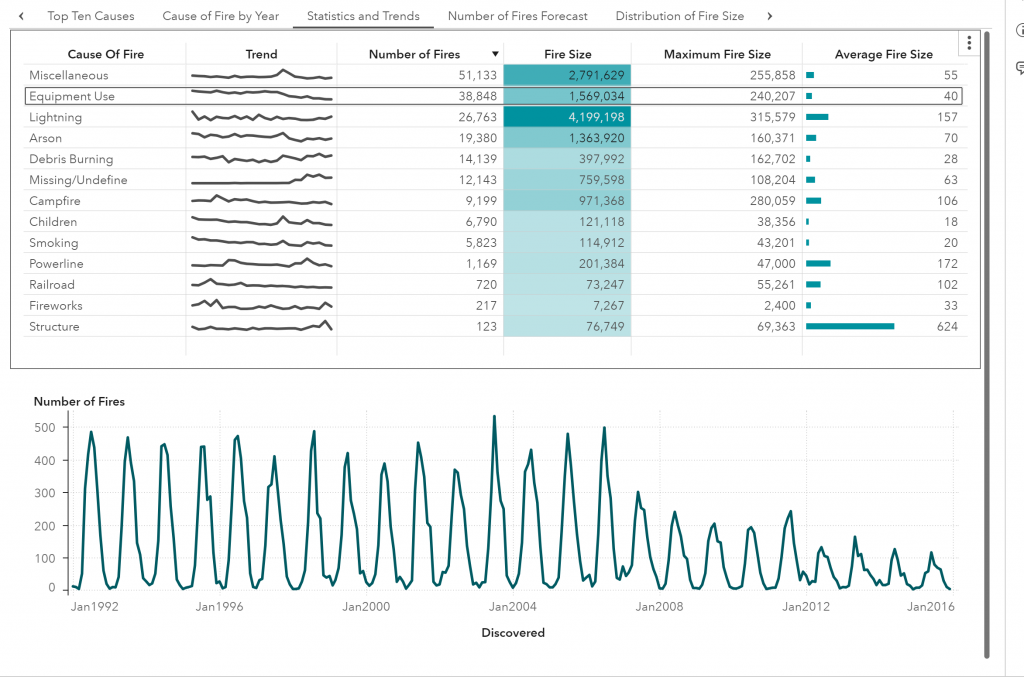
We can go even further and do some advanced analysis to look at a forecast for equipment use as a cause of wildfires to see if this trend will continue to decrease.
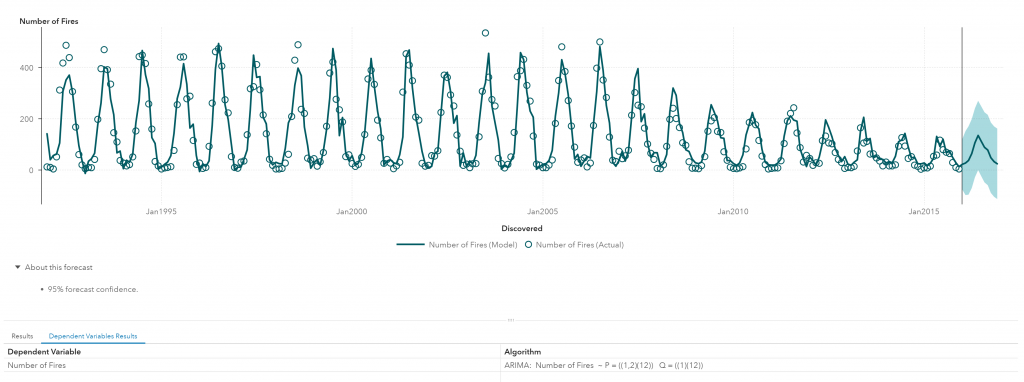
SAS Visual Analytics has determined that the ARIMA algorithm is the best one to show the predicted number of fires caused by equipment use here in California. Here we can see the number of wildfires predicted to occur over the next 12 months. We could use this to help fire departments manage personnel.
Let’s go back and look at the statistics and trends and see what other information we can gain from this data. Using the heatmap on the fire size column quickly shows me that although miscellaneous and equipment use causes the most number of fires in California, lightning has caused the most land damage.
It's also interesting that structure wildfires, on average, cause some of the largest wildfires here in California. Hmm…. That does seem a little off. Let’s look at this data using box plots and ignore any outliers so we can get a general look at the distribution.
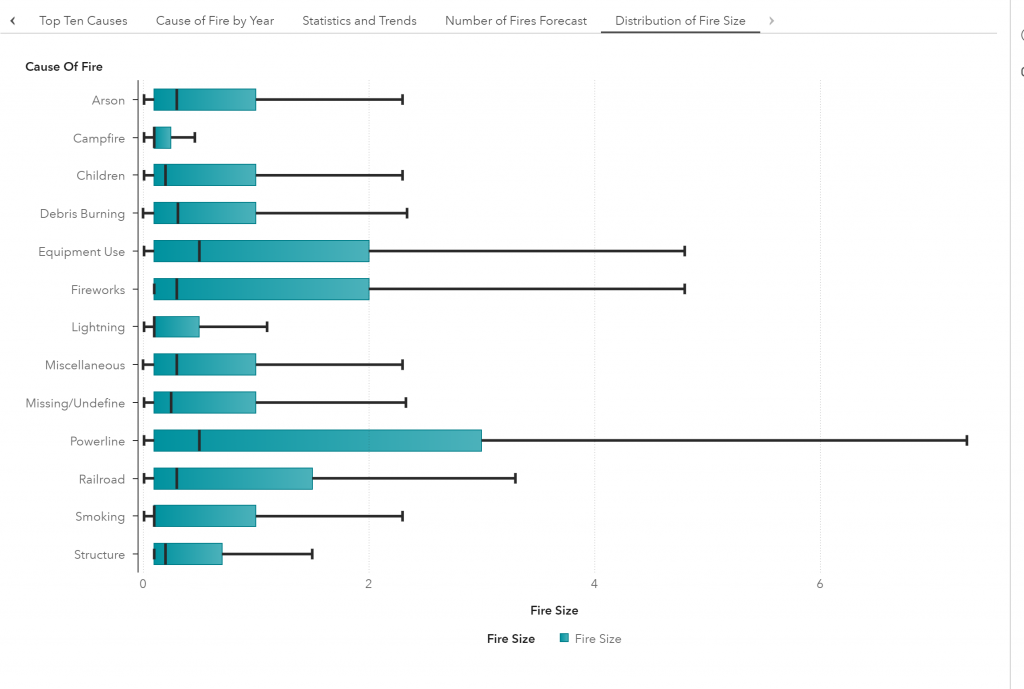
Looking at the distribution of fires by fire size, we can see that powerlines and equipment use have the highest median values. This means that if we were to arrange all the fires caused by powerlines from smallest to greatest the fire size in the middle of the list would be greater than any other middle point for other causes. This provides a better picture of the amount of damage a particular fire might cause. Let’s look at the details for structure fires.
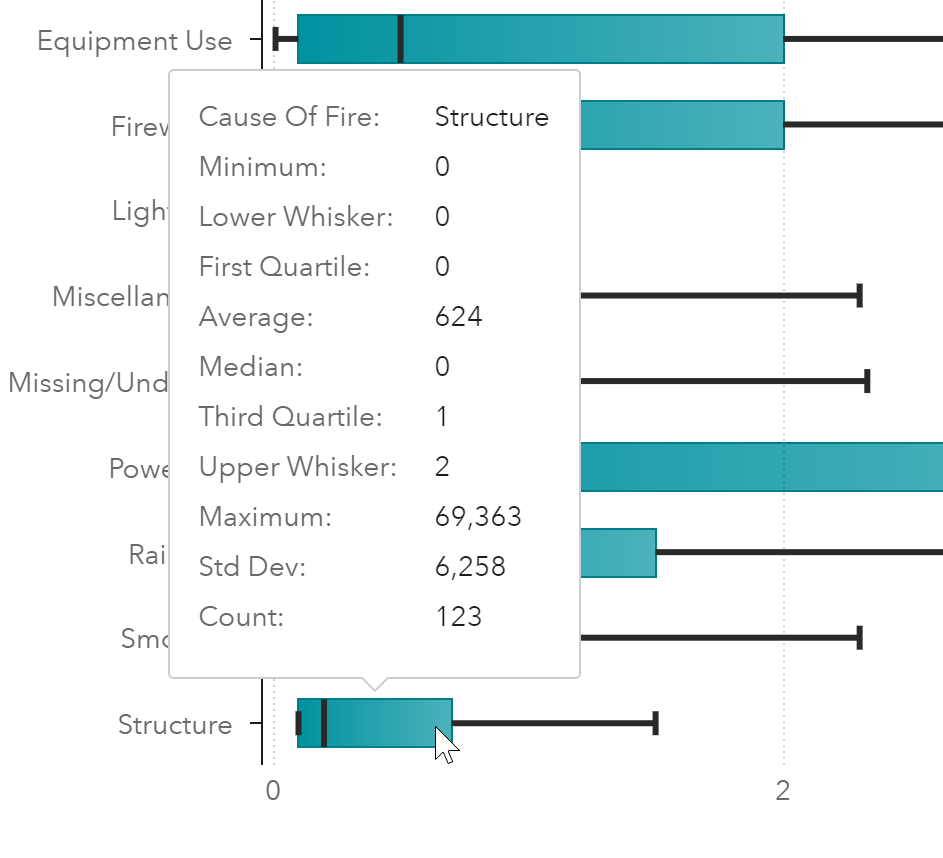
Here we can see that our maximum wildfire size was 69,363 acres. This number is probably the reason why our average is so high. If we look at the distribution of fire sizes for structure, we can see that most of the structure wildfires burn less than two acres. In fact, our median (middle number in our list of least to greatest fire size) is below 0.5 acres. If residents of California want to reduce the number of wildfires and the damage they cause, we should focus on powerlines and equipment Use.
Preventing wildfires
Seeing as I am concerned wildfires here in California, what can I do to reduce equipment use fires? According to The California Wildland Fire Coordination Group (CWCG), equipment such as lawn mowers, chain saws, trimmers and dirt bikes can cause a wildfire. They provide some simple ways to reduce the fire risk. For example, when mowing, mow before 10am and avoid mowing when it’s windy or excessively dry. The metal blades can create sparks when they hit rocks so be careful when mowing. Use a weed Wacker to keep dry weeds and grass to a minimum. They also mention using spark arresters, not driving vehicles on dry grass and minimizing soil disturbance to protect water quality.
For more great wildfire visualizations, check out this cool visualization using the same data created in SAS® Visual Analytics that my co-worker Falko Schulz created.
Want to explore SAS Visual Analytics for yourself? Check out the Interactive Demos and the Free Trial.
Data provided by:
Short, Karen C. 2017. Spatial wildfire occurrence data for the United States, 1992-2015 [FPA_FOD_20170508]. 4th Edition. Fort Collins, CO: Forest Service Research Data Archive. https://doi.org/10.2737/RDS-2013-0009.4

2 Comments
Melanie,
it seems strange to me that "miscellaneous" should be so high on the pareto of causes of fires. Does the USDA need to get better at classifying the causes of fires? Or better at binning fires into the causes they already have?
Chris,
Thanks for your comment and your observation! There definitely seems like quite a few of miscellaneous fires. That could be throwing off the analysis as some causes of fires may not be fully represented. The USDA stated that the data was collected from multiple sources. They collected data from Federal, State and Local agencies. They were more focused on ensuring that the data listed discovery date, final fire size and a point location. I know they tried to conform to the data standards of the National Wildfire Coordination Group (NWCG). So perhaps some of the reporting agencies didn't include information on cause? Or maybe some fire causes were unknown....