What is information? The lack of a working definition plagued both science and the emerging telecommunications industry until the arrival of Claude Shannon and his famous 1948 paper, “A Mathematical Theory of Communication”, based on his cryptography work during WWII while at Bell Labs. The landmark article is considered the founding work of the field of information theory, and would augment Shannon’s earlier groundbreaking research at MIT into the design of digital circuits and digital computers.
 Shannon interpreted his formal definition, H = -∑ pi log (pi), in a number of counterintuitive ways:
- As a measure of entropy (the formula exactly mirrors Boltzmann’s definition of thermodynamic entropy)
- As the resolution of uncertainty
- As a measure of surprise
While that first definition has captured the attention of the likes of physicist Stephen Hawking and has implications for cosmology, black holes and a holographic universe, it’s the latter two that are of interest to us for the moment.
It was also Shannon who coined the term, “bit”, for “binary digit”, but unlike everyone up to that point, he didn’t define information as simply a quantitative count of words, characters, or even his own bits, but instead saw information more in terms of what unexpected content the message conveyed.
For example, which of the following contains more information:
- 0.1111111111…
- 001
You might think there is more information content in an infinite string of 1’s, but there’s really no value beyond the first “1”, as I can write the same thing as 0.(1), or even as 1/9, whereas the second example, 001, assuming I’m in binary, reduces the uncertainly down to one of eight possible values for three bits (23).
Shannon was adamant about this uncertainty aspect of information. Information was a stock price you didn’t know, an unexpected weather forecast, perhaps affecting crops or shipping routes, or finding out who dunnit at the end of a murder mystery. The uncertainty is resolved: the stock price went down, the storm will miss the coastline, the butler was innocent this time. That was information.
Even more counterintuitive is the notion that the character string with the most information content would be one that is completely random, for to duplicate it you would have to rewrite it exactly, it cannot be simplified or compressed (π, contrary to what you might think, would NOT be a high information number, for although the digits are random, π itself is not – it’s the result of a mathematical calculation that can be specified with a finite number of characters, my favorite being this one from Ramanujan). Most information strings fall somewhere in between, with many of the characters being redundant – English has an estimated redundancy of 75%, meaning that the information content of its words and characters is a mere 25%.
75%? That much? Try this: I’m going to ask you to guess the next letter in this sentence: “HE SET THE BOOK DOWN ON THE ____.” Your first guess might be a “D”, but if I said that was incorrect, your next guess would likely be a “T”, and if I confirmed that, you could then correctly rattle off the next four letters of “table” without hesitation. You would be quite surprised if I said that guess was also wrong, the word I was looking for was “terrarium”. Yes indeed, English has a lot of redundancy, which in a language is actually a good thing, for it helps reinforce and clarify the meaning via repetition and error correction (“If u cn rd ths u cn gt a gd jb w hi pa!”).
The element of surprise, the resolution of uncertainty – that’s information. The kind of information you get from analytics:
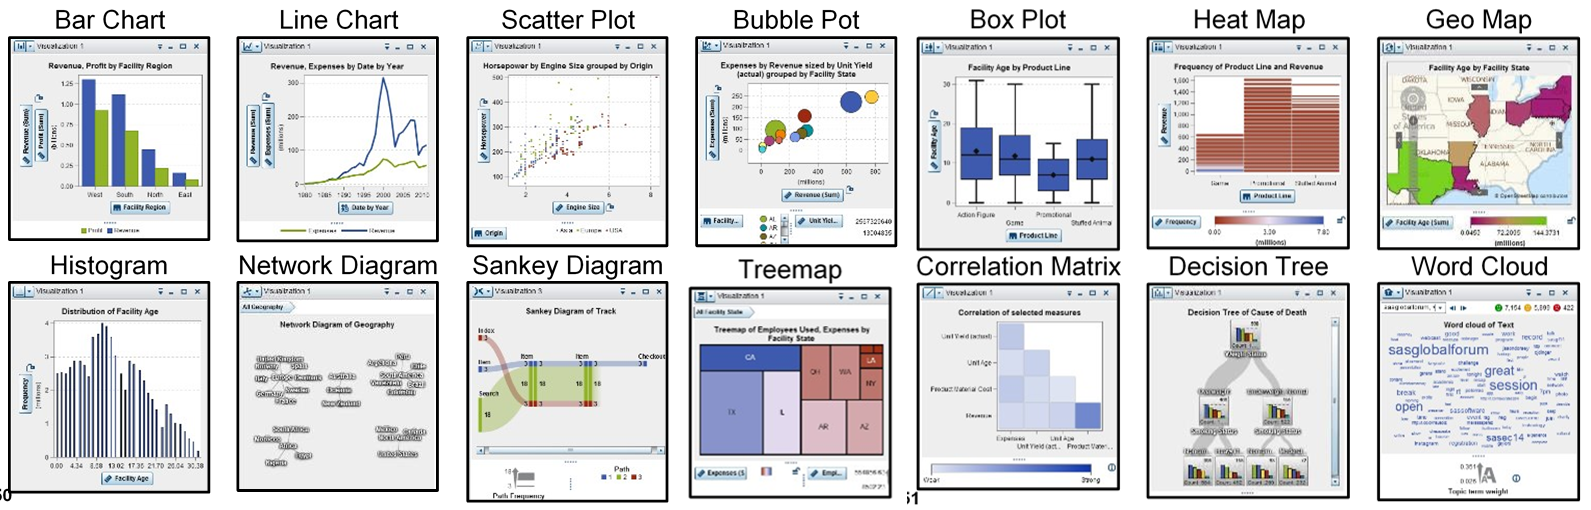
- Correlations (“I had no idea those two things were related, let alone how strongly!”)
- Forecasting (“I had no idea our seat-of-the-pants forecasts were worse than a random walk!”)
- Clustering (“Did you know 38% of our customers buy these two items together on the same shopping trip?”)
- Networks (“Did you know that the second most frequent path leading to a new purchase starts on the Tech Support page?”)
- Treemap (“85% of our aged inventory is sitting in just three warehouses?”)
- Geo (“Notice how the highest customer sat scores are clustered around the regional DCs.”)
- Decision Trees (“Interesting how two-thirds of our quality problems seem to involve a combination of one particular component supplier running on one particular production line.”)
- Histogram (“It’s pretty obvious that our failure rates don’t fit a normal distribution profile at all.”)
- Bar chart (“I would never have thought that the brands performed so differently in the different channels.”)
- Bubble chart (“I would never have thought the new product ramp-ups would differ so widely by product group.”)
- Scatter plot (“Turns out our marketing responses aren’t random at all – look at that nice regression fit line!”)
One last application, event stream processing, perhaps best highlights the contrast between data and information. The information content from an equipment sensor, reporting no significant variation from the norm for temperature, pressure or RPMs, hour after hour after hour, is minimal, a lot like that infinite string of "1s". It's the infrequent but critical out-of-tolerance reading that's the real news, and the ability to react quickly is the value.
Initially there was a fair amount of resistance to Shannon’s “uncertainty” and “surprise” definition of information. Depending on their discipline, researchers in the 1950s still wanted information to be defined around “quantity” or “meaning”, but eventually Shannon’s approach won the day, especially among the telecommunication and computer engineers who relied on his insights to design the systems we use today.
There’s not much value in telling me something I already know – the value, and the information, lies in learning something new. The same applies to your ability to differentiate yourself in the marketplace – you can’t differentiate, you can’t compete effectively, by going with the crowd. Analytics can be your competitive edge by telling you something neither you, nor the market, already know.

2 Comments
Oh Leo ... I feel kinda bad admitting this ... but I'm totally stealing your idea. Love the way you present the charts with ways to interpret it.
(I'm an honest crook ... give me that!)
🙂
We honest crooks have got to stick together - now if you'll excuse me, I'm off to steal next week's blog idea from somewhere myself...