How’s your oil book looking? As prices continue their decline, the industry is making rapid adjustments, including project shut-ins and corporate restructurings. With WTI at $55 per barrel and the forward price five years out hitting $66, energy firms are scrambling to lock in value while bargain hunters start to sniff out attractively priced oil and gas investments.
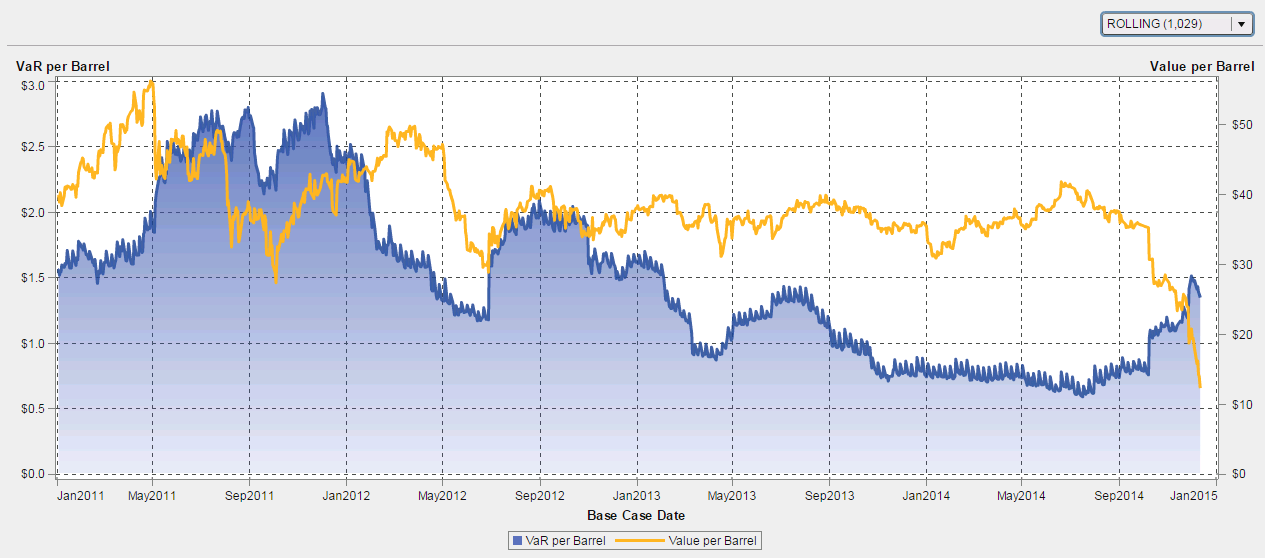
As a simulation exercise, SAS has created a fictitious oil portfolio nicknamed VirtualOil, which readers can use as a generic benchmark against their physical oil commodity book’s performance. Each month, we reflect on what the visual analytics can tell us about the portfolio’s movement. This chart represents both Mark-to-Market and Value-at-Risk, at the barrel level, of the rolling five-year portfolio. This month, VirtualOil still shows a value of $12.29 per barrel over our $50 strike price, even though the portfolio is heavily weighted toward the first few months. The optionality becomes more valuable as we approach the strike price.
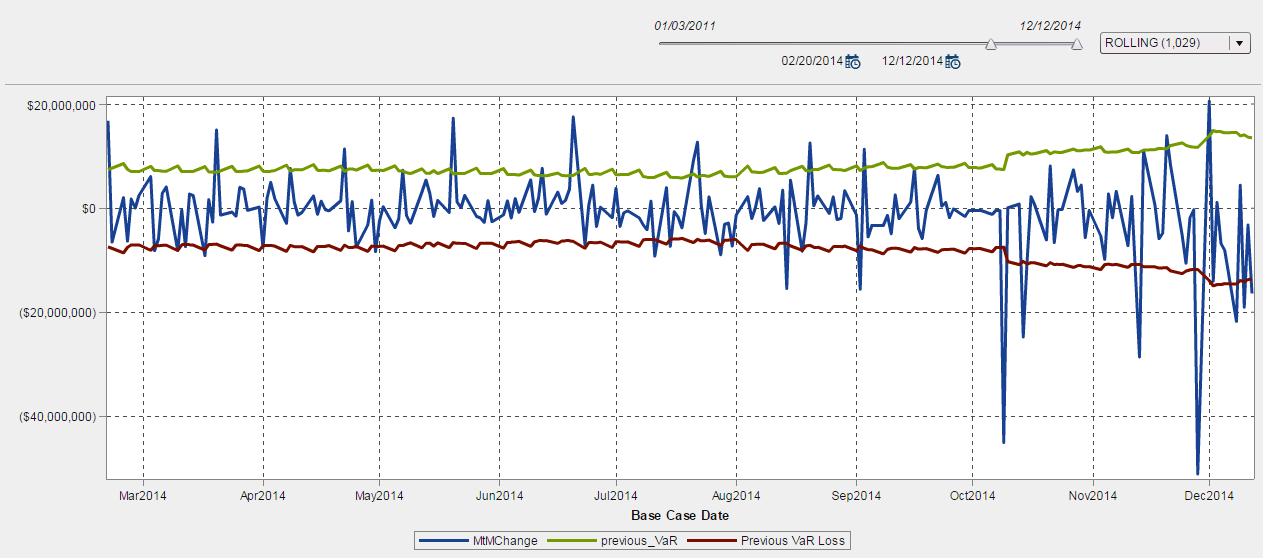
Value-at-Risk has jumped up again, as the chart below clearly shows. Additional backtesting reveals that the portfolio has frequently blown through its downside VaR limits as the market correction continues. But VaR has yet to hit the levels seen in 2012, and price still has a way to go before it reaches the lowest low in recent memory, WTI’s $39 bottom in 2009 in the wake of the financial crisis.
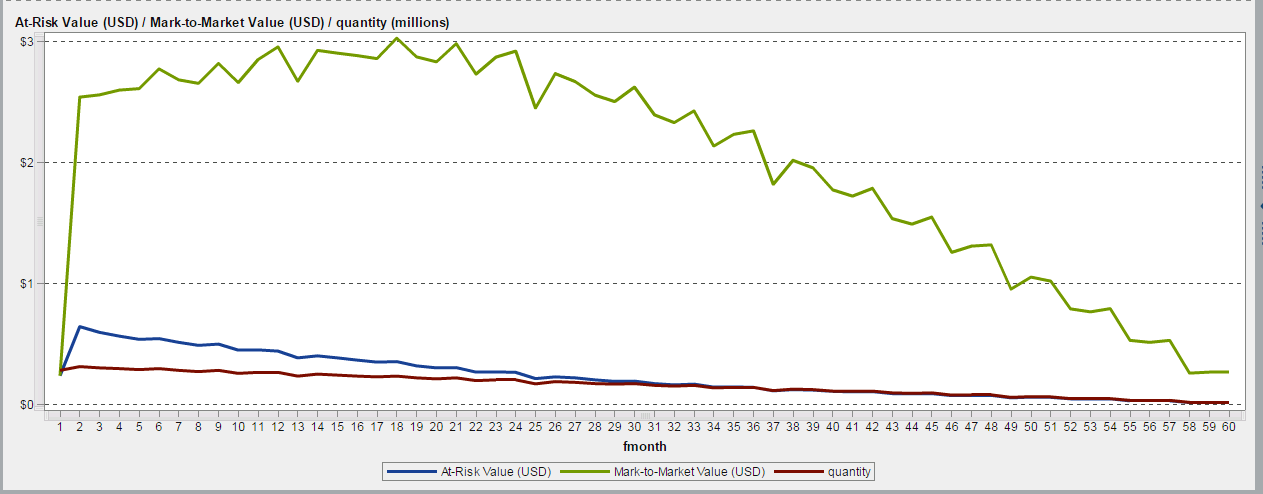
Analysis of VirtualOil’s current Value and Value-at-Risk based on the forward month shows that the quantity and VaR are decreasing linearly, but the value actually peaks about 18 months out. The increased time to maturity and the slightly higher prices outweigh the decreased volume.
The current decline does highlight the importance of knowing the price at which your company can sustain its operations, and being ready to hedge as the market approaches that level. Since VirtualOil’s use as a benchmark means the portfolio is not hedged, our imaginary investors would be getting nervous about the continued price declines. But a portfolio can retain its value if a dip, even a dramatic one, is relatively short-lived. Spot prices don’t tell the whole story, and the longer view suggests a return to value as 2015 progresses.
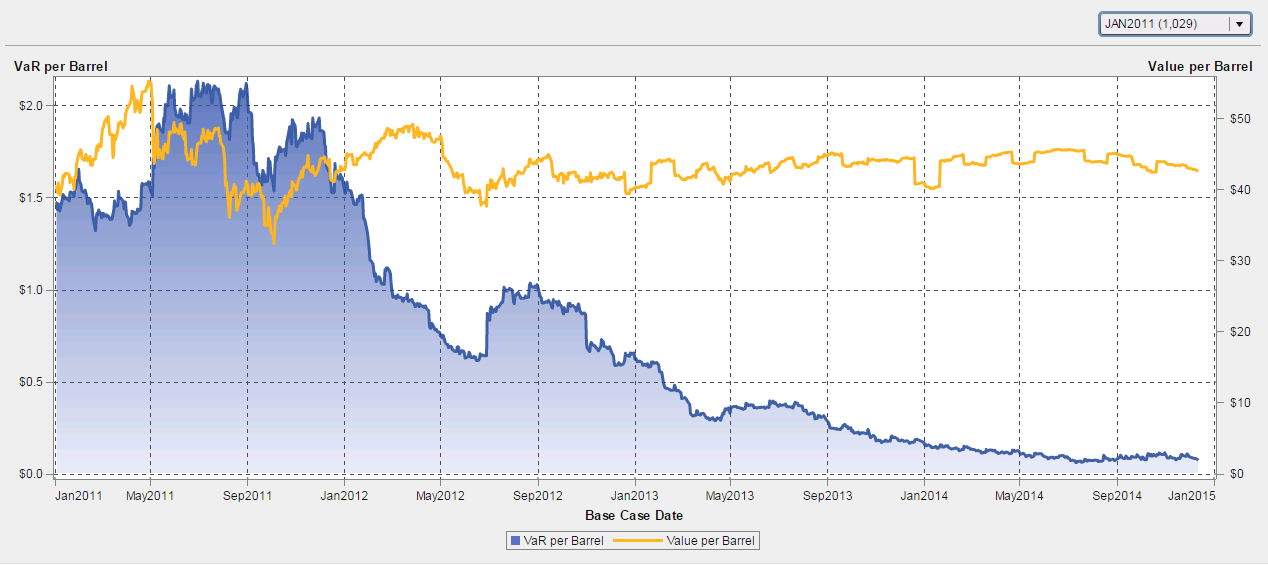
See below for additional visualizations of varying vintages. Join us back here each month to see how VirtualOil is performing and how the risk analysis is evolving.
Assumptions
The hypothetical derivatives-based oil production firm VirtualOil simulates the performance of a generic crude oil asset, and delivers sectorial exposure to the commodity oil market. Specifically, the VirtualOil structure starts up with an investment of $350 million in monthly average price call options with a strike price of $50/barrel on the price of West Texas Intermediate (WTI) light sweet crude oil. The strip of options starts at 10,000 Bpd and extends out for 5 years with a 20 percent average annual decline in underlying notional barrels, replicating a physical oil asset. VirtualOil initially holds notional crude oil reserves of approx. 10 million barrels. Monthly cash flow is generated when the daily average WTI price relative to the preceding month exceeds $50/barrel. Cash flow is reinvested monthly at 5 percent and the project winds up when the reserves are depleted.
VirtualOil is managed in SAS® BookRunner with reports surfaced in SAS® Visual Analytics. Learn more about SAS BookRunner’s state-of-the-art energy trading & risk management capabilities.
VirtualOil Jan 2011 Start Date Portfolio
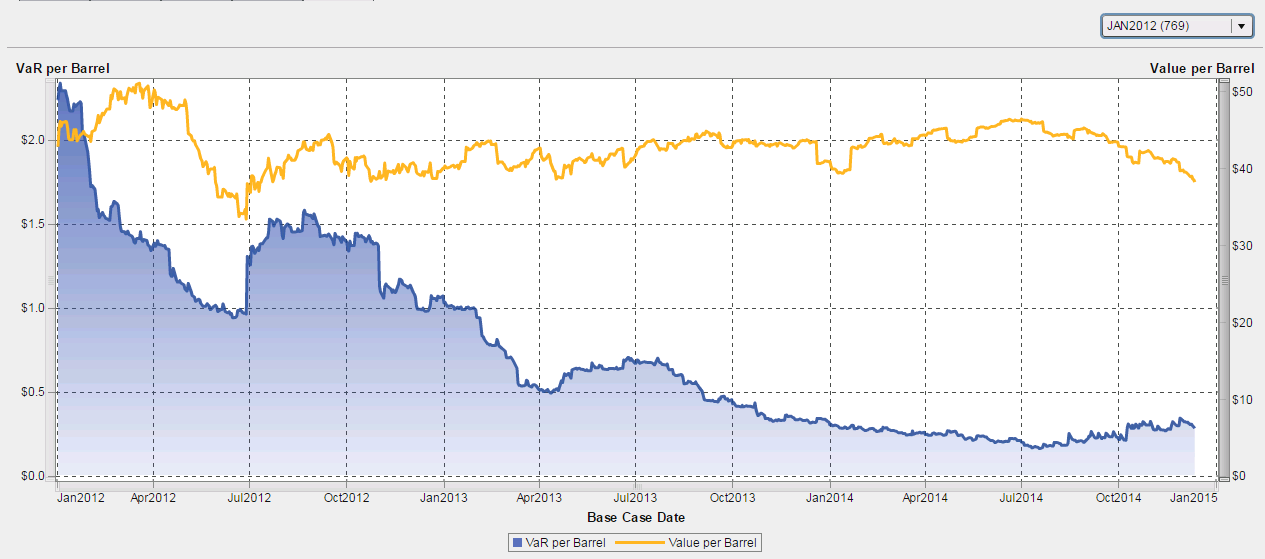
VirtualOil Jan 2012 Start Date Portfolio
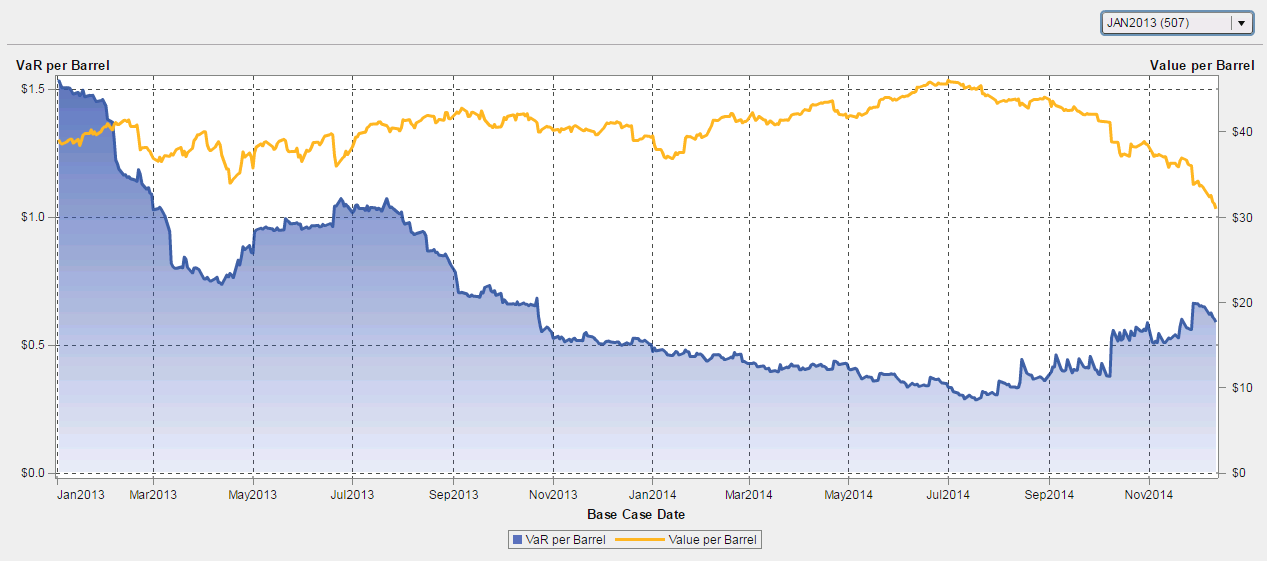
VirtualOil Jan 2013 Start Date Portfolio
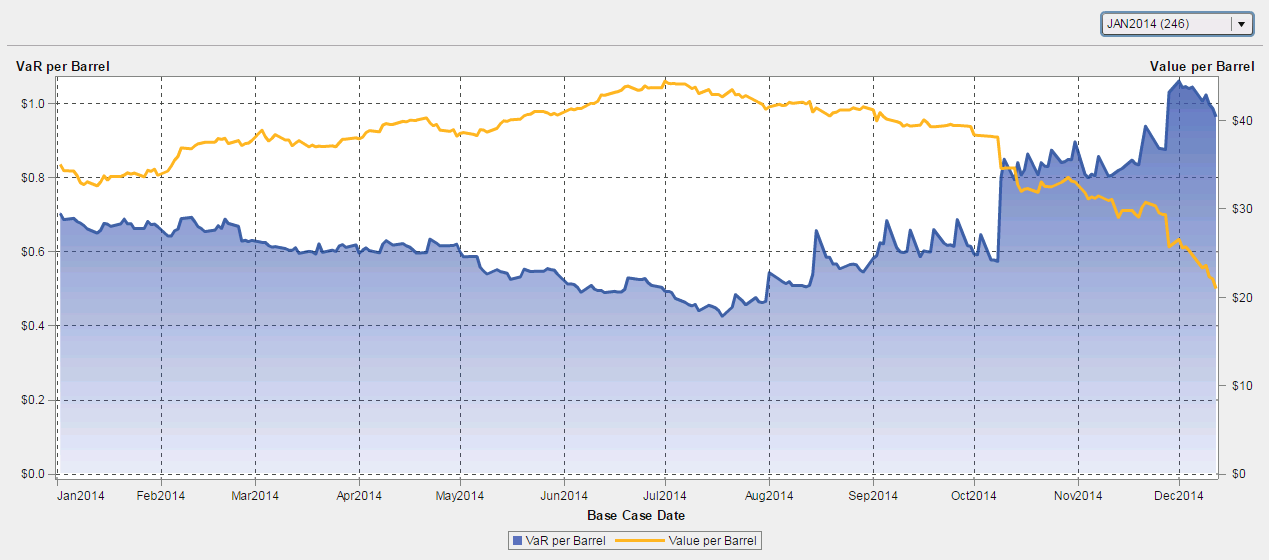
VirtualOil Jan 2014 Start Date Portfolio
Disclaimer: This is a fictitious portfolio and is not a solicitation to trade.