As a simulation exercise, SAS has created a fictitious oil portfolio, VirtualOil, which readers can use as a generic benchmark against their physical oil commodity book’s performance. Each month, we reflect on what the visual analytics can tell us about the portfolio’s movement, with additional commentary and granular chart views below.
VirtualOil picked an intriguing time to get into the business. In early November, Saudi moves to cut oil prices for the second month in a row had commodity traders speculating about a price war in an already soft price environment.
Are major exporters trying to nip US domestic oil production in the bud? As the price of oil continues its precipitous slide from three-digit highs to the mid-$70s, some North American fracking operations have become uneconomical. While these unconventional operations have been shuttered as the price dips, VirtualOil’s purely derivatives-based portfolio continues to exercise its option to produce. With a strike price set at $50 all-in, VirtualOil is still in the money and investing returns at 5 percent.
The hypothetical portfolio can do this because it is not a price-taker. As oil prices continue to trend down, VirtualOil has made a conscious decision not to hedge. That’s because our fictitious investors are looking for participation in the energy commodity markets. (EDITOR'S NOTE: In reality, adding hedges to our book would ruin its effectiveness as an intended benchmark.)
The latest International Energy Agency report expects the search for oil’s price floor to continue in this supply glut climate, but it’s unclear if OPEC will cut back production when it meets at the end of the month. Some market observers are anticipating the current price move will settle out around $70. Others are calling for a Fibonacci retracement closer to $41. Expect those who look to the “golden ratio” for the price trend reversal to be selling some hedges.
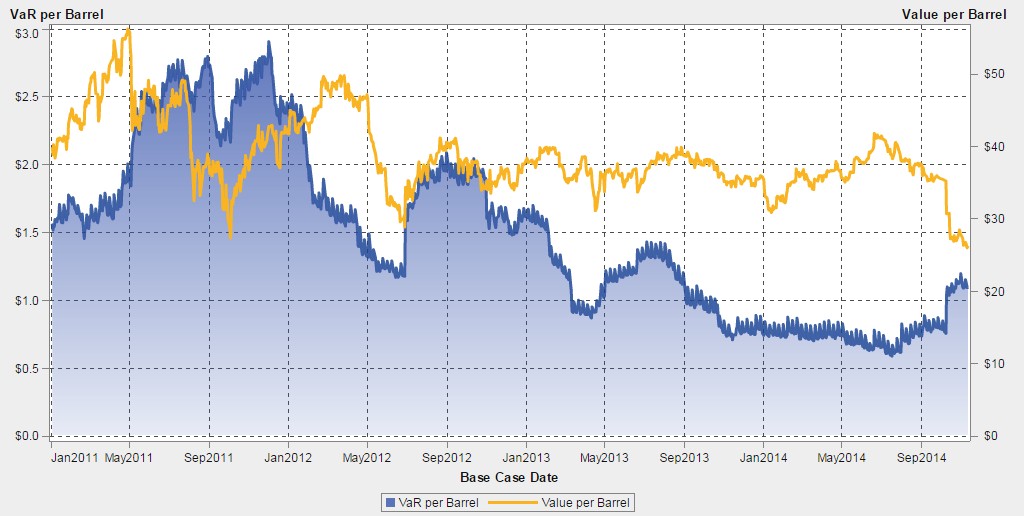
The chart below represents both mark-to-market and value-at-risk, at the barrel level, of the rolling five-year portfolio. Views for different vintages, plus VaR backtesting analysis, are below. Join us back here each month to see how VirtualOil is performing and how the risk analysis is evolving.
Chart: VirtualOil Five-Year Rolling Portfolio
Assumptions
The hypothetical derivatives-based oil production firm VirtualOil simulates the performance of a generic crude oil asset, and delivers sectorial exposure to the commodity oil market. Specifically, the VirtualOil structure starts up with an investment of $350 million in monthly average price call options with a strike price of $50/barrel on the price of West Texas Intermediate (WTI) light sweet crude oil. The strip of options starts at 10,000 Bpd and extends out for 5 years with a 20 percent average annual decline in underlying notional barrels, replicating a physical oil asset. VirtualOil initially holds notional crude oil reserves of approx. 10 million barrels. Monthly cash flow is generated when the daily average WTI price relative to the preceding month exceeds $50/barrel. Cash flow is reinvested monthly at 5 percent and the project winds up when the reserves are depleted.
Visual analytics: Value-at-Risk Backtesting
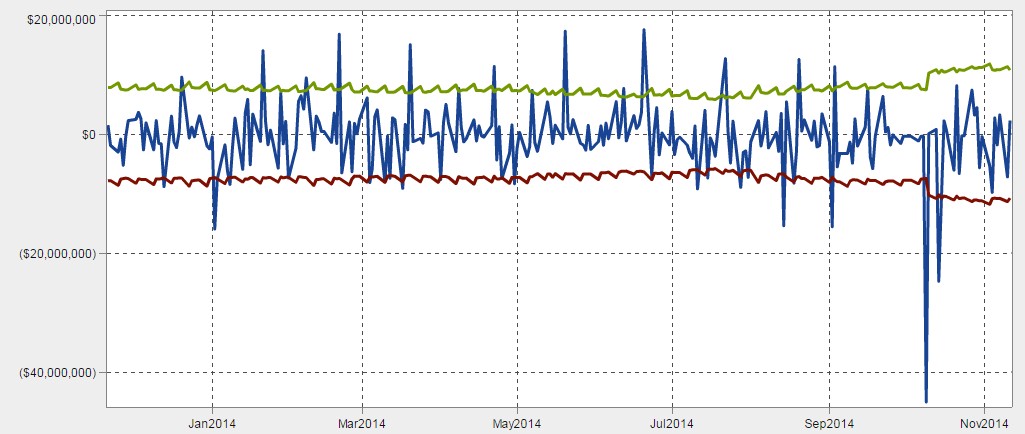
Backtesting value at risk (VaR) is a good way to validate one of your key risk metrics. The chart below clearly shows asymmetrical price movements. We expect to see a spike in our Mark-to-Market (blue) above the green VaR line once a month, when the rolling portfolio rolls forward positions to the next month. But it’s important to be sensitive to mark to market (MtM) dipping below the red VaR line. For example, if you were breaching a 5 percent VaR every 10 days instead of every 20 days, you might want to alter your approach and run backtesting.
For VirtualOil’s rolling portfolio, we can derive a few interesting insights from our VaR backtesting chart. It looks like the VaR of the portfolio has actually been on the rise since August, well in advance of the big drop in October. What’s more, there were only two days in October that blew through our VaR. Despite those two days of losses, the MtM changes since then have been relatively stable.
Chart: VaR Backtesting: Five-Year Rolling Portfolio
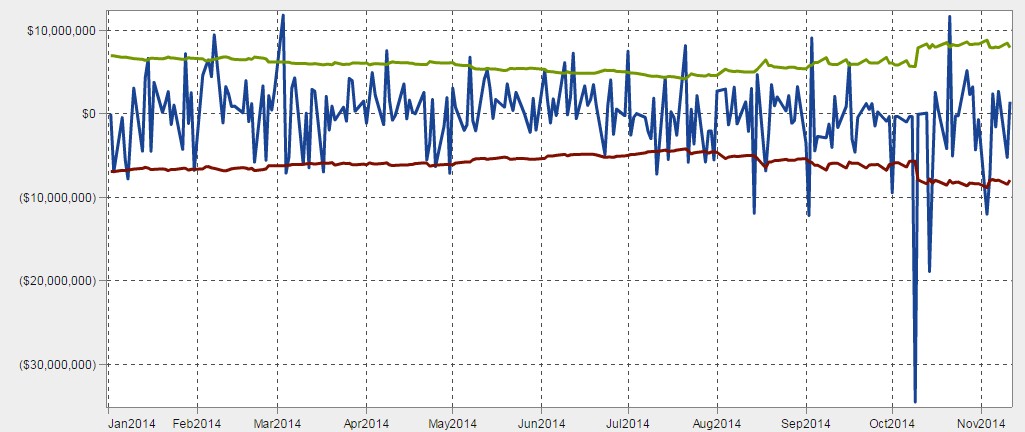
Note the variations between this and the fixed portfolio of 2014 vintage below. (You don’t see the same monthly jumps in MtM Change each month because the positions are not rolling forward.)
Chart: VaR Backtesting: 2014 Start-Date Portfolio
VirtualOil is managed in SAS® BookRunner with reports surfaced in SAS® Visual Analytics. Learn more about SAS BookRunner’s state-of-the-art energy trading & risk management capabilities.
Chart: Jan 2011 Start-Date Portfolio
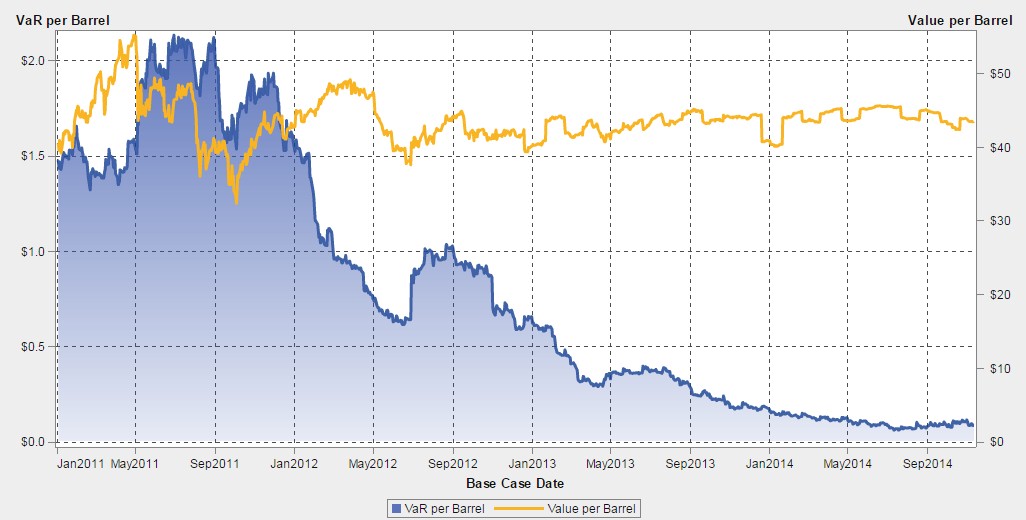
Chart: Jan 2012 Start-Date Portfolio
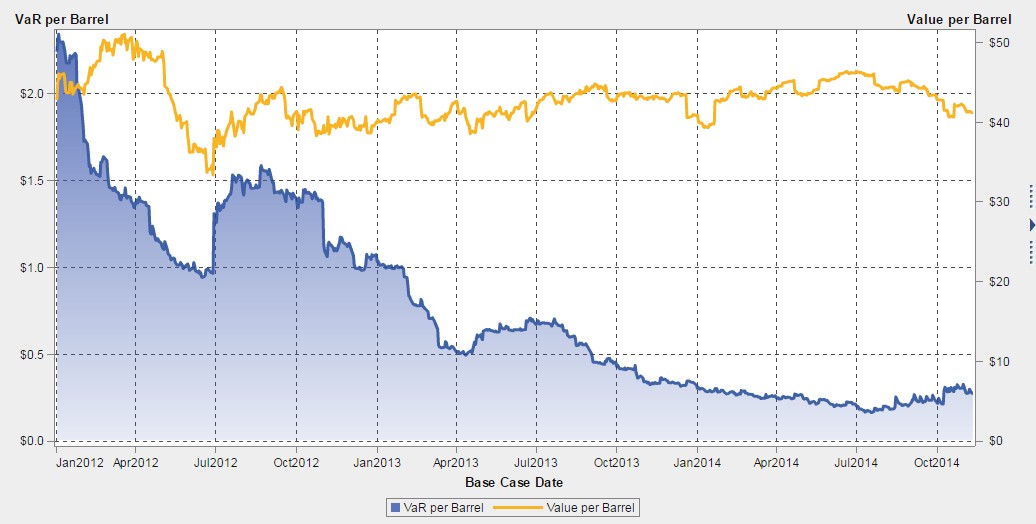
Chart: Jan 2013 Start-Date Portfolio
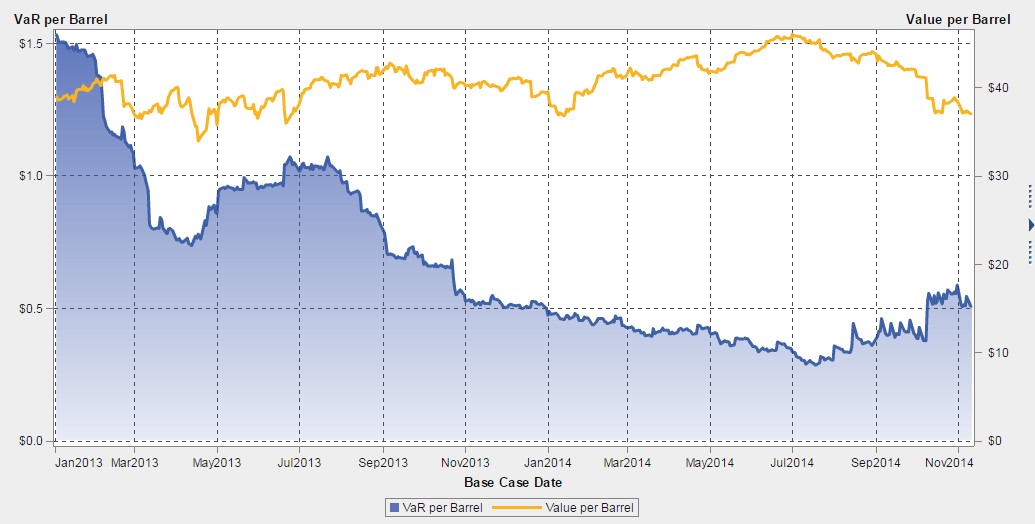
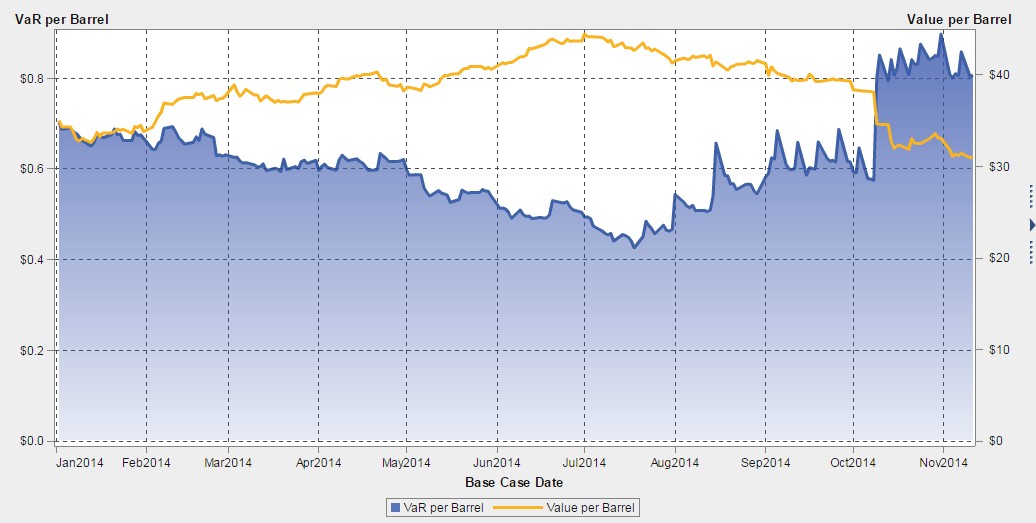
Chart: Jan 2014 Start-Date Portfolio
Disclaimer: This is a fictitious portfolio and is not a solicitation to trade.