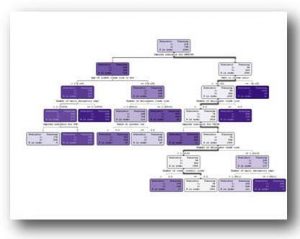
 Insights from decision trees and other basic analytic techniques show that you don’t always need complex analytics to solve business problems and add value. This was the message from Dr. James (Jim) Foster, Director of Research and Process Development, Archer Daniels Midland (ADM), at last month’s inaugural IE Group ‘Manufacturing Analytics Summit’ in Chicago, which I had the great privilege to chair for both days.
Process manufacturers like ADM face a different production and quality challenge than their discrete manufacturing counterparts. It’s not so much keeping your parts and components within tolerance as it is keeping your entire process within its operating limits. Neither do you move discretely from state or condition “A” to condition “B”, from an unfinished blank to a finished part, but instead the condition of the work product changes continuously as it progresses in time through the process. Most importantly, there is typically not just one acceptable, final product specification, but a whole set of process specs that vary as the reactants move through the system, or through time even if the physical product remains stationary, perhaps in a vat or mixing chamber.
Jim started with a fairly basic process by describing how he and his team go about using decision trees to analyze and search for the root causes of process production problems, which I will greatly simply for the purposes of this post.
Imagine you are processing corn into one of dozens of its many possible end products, and that you need to regulate and control three production factors: temperature, ph level, and enzyme concentration. Research has determined that each of these three parameters must remain within certain basic limits in order to obtain a satisfactory final product: the temperature must not vary by, say, more than two degrees either way, the ph by 0.2, and the enzyme concentration by 2%.
You are of course monitoring this process, collecting data either continuously or at regular intervals, and either manually or automatically making corrections to keep everything copacetic.
But experience tells you that this is not all there is to the story. Years of manufacturing knowledge will have shown that in combination, these three factors must further conform to even tighter tolerances for the process to succeed. In other words, compared to when each factor is evaluated on a stand-alone basis, when combined and managed simultaneously, each tolerance might need to be cut in half. Otherwise, experience shows that the viscosity may sometimes increase just enough to slow down the flow and gum up the works, even though by themselves the three parameters never departed sufficiently from the norm to degrade or destroy the end product, and therefore no alarms went off.
Example: Let’s say that the mixing unit has lately been gumming up and stalling, even though no individual temperature, ph or enzyme alarms have been recorded. A four-level decision tree analysis of the data (top level being the combined total, with each subsequent level separating out one of the three control factors) might show that 85% of these high viscosity incidents occur when both temperature and ph are operating at the very high end of their range, say 95%, and when the enzyme concentration is at the very low end. You have just learned something valuable and can adjust the operating parameters accordingly, perhaps resetting all of them to 85% of their previous values, ensuring that now, even if they are all at their range extremes, the viscosity will remain acceptable.
For experienced production engineers this would be a relatively easy problem that typically wouldn’t require even something as simple as a decision tree to diagnose. But real world process production problems are seldom this simple. First - oh, if there were only three variables! The complexity increases exponentially with each additional parameter, and once you get above half a dozen or so, nothing remains intuitive. Having the data and the analytic tools becomes imperative.
Secondly, real world problems don’t always have just one, single root cause, something even the most experienced of production engineers can forget. Multi-causal problems, Jim stated, is where having the discipline of an analytic approach really pays off.
Jim shared with us a second, more complicated example of the same sort - high viscosity causing machine shutdowns. Production engineers used to looking for only a single cause were baffled that none of their corrective measures seemed to work. Jim’s decision tree analysis of the production data showed that it was not just one path down through the decision tree, but THREE separate and independent paths, that were leading to the production problems. Changing parameters to solve just one of the problem paths was exacerbating the issues caused by the other two routes. It was only when all three of the root causes were addressed simultaneously that the production process returned to normal.
Decision trees are only one of many basic analytic tools available to be put to good use like this. SAS Visual Analytics provides you with an entire toolbox, an entire workshop even, of easy-to-use analytic capabilities, such as autocharting, which automatically chooses the graph best-suited to display the selected data, or the "What does it mean" capability, which automatically identifies and explains the relationships between variables.
Whether you are process or discrete, or any industry for that matter, you’ve got the data and the industry expertise, SAS has got the tools - all you need is the analytic discipline.

1 Comment
Pingback: Analytics – Easy as One, Two, Tree | EPM Channel