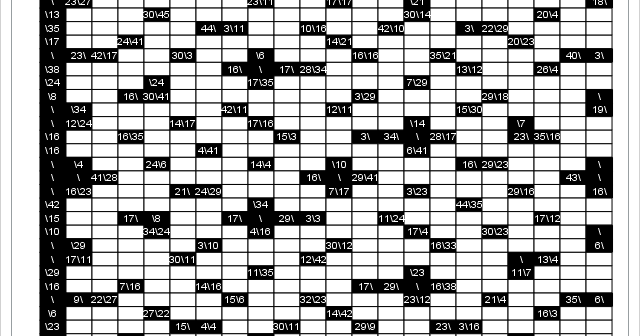
Erwin Kalvelagen recently posted about a logic puzzle called Kakuro, also known as Cross Sums. As in traditional crossword puzzles, there are horizontal and vertical clues. As in Sudoku, each white cell is to be filled in with a digit from 1 to 9, with no digit repeated within the
mixed integer linear optimization
There has been a lot of speculation over the years about the quality of the optimization solvers in SAS/OR, in particular the mixed integer linear optimization (MILP) solver. Measuring the performance of optimization solvers and comparing different solvers on a test set is a crucial part of modern optimization solver development.
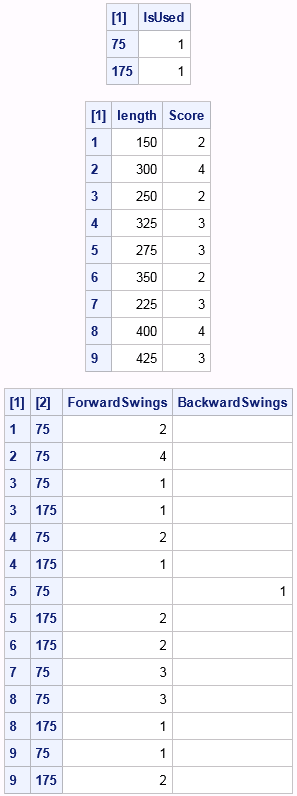
Here's a golf puzzle from Sam Loyd: Everybody is playing golf now, and even the lazy ones who a few weeks ago declared how much pleasanter it was to swing in a shady hammock, have caught the golf fever and are chasing the ball around the golf links. I am
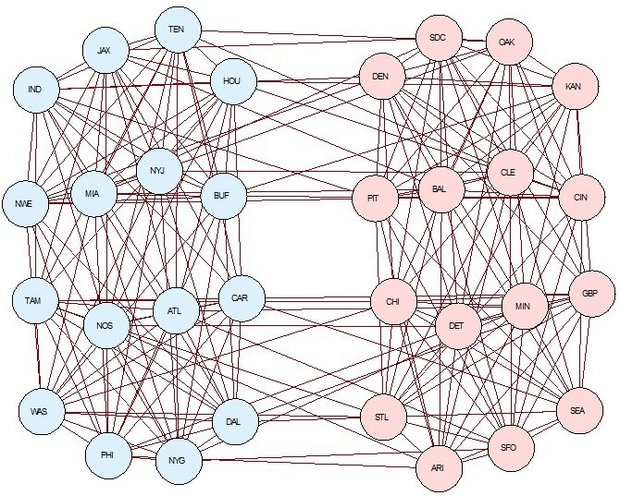
Super Bowl 50 (L?) is this Sunday, so it's time for another (American) football-related post. Steven Miller, a mathematics professor at Rutgers University, recently noted that the 2015 NFL schedule allowed a competitive advantage for some teams (including the Carolina Panthers). This figure he generated displays the 2015 regular season
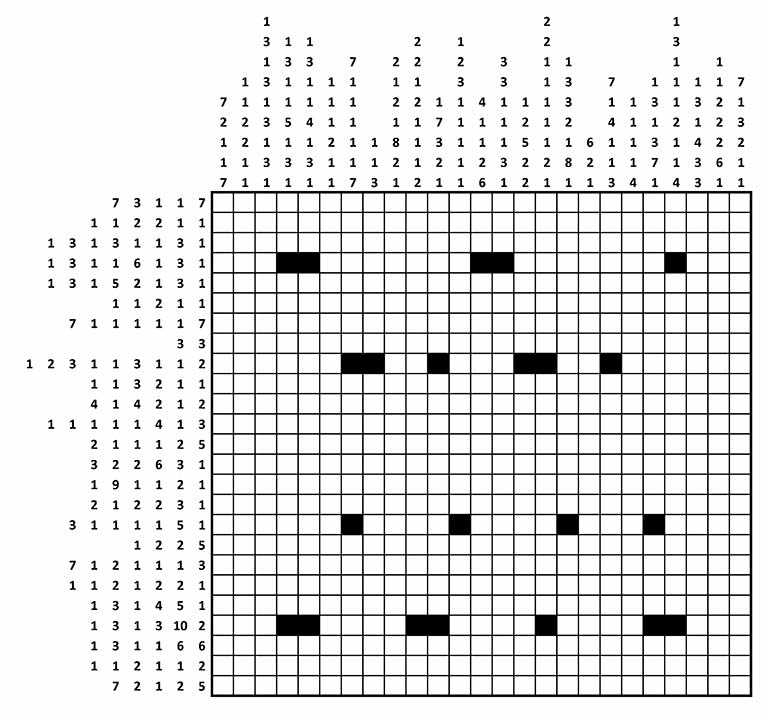
The British spy agency GCHQ recently posted a grid-shading puzzle that the director sent out in his Christmas cards this year. The puzzle, shown here, is known as a nonogram and by various other names, including Paint by Numbers and FigurePic: Each cell is to be colored black or white,
SAS/OR 14.1, which became available on July 14, delivers a number of new and enhanced features in optimization and simulation. These changes are designed to make SAS/OR even easier to use and to enable you to model and solve larger, more complex problems more efficiently. If you're using SAS/OR now,
During the week of July 13-17, 2015 most optimization experts will attend the 22nd International Symposium on Mathematical Programming (ISMP2015), which is this year's most important optimization conference. Several members of the SAS/OR team will attend. We will give various talks during the week, here is our schedule.
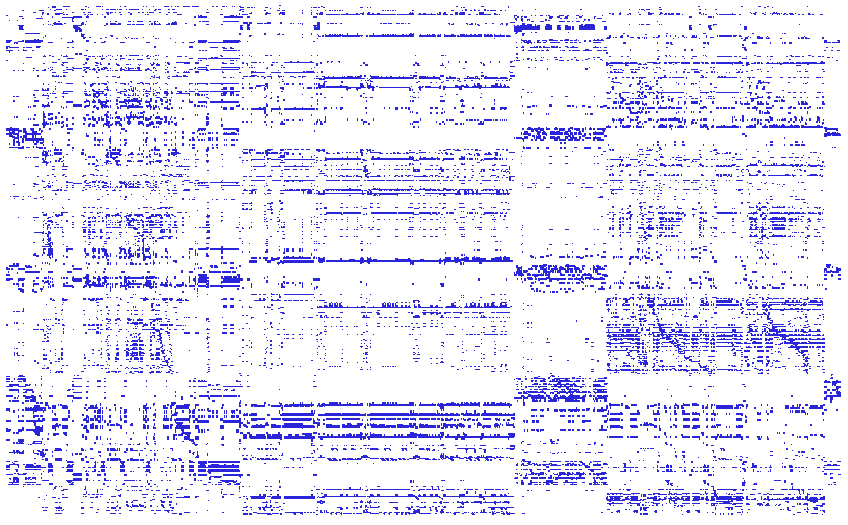
In 2013, Rick Wicklin blogged about visualizing matrices as heat maps using SAS/IML. That post reminded me that we had done a similar thing for the coefficient matrices in our optimization problems. In particular, we have developed some SAS macros to visualize the input data sets for the OPTLP (linear
Good Old Country-Style Optimization In an odd way, Imre Polik's recent post, How to solve puzzles? Peg solitaire with optimization, reminded me of one more reason why I like to eat at Cracker Barrel, an American chain of country-style restaurants.
The primary objective of many discrete-event simulation projects is system investigation. Output data from the simulation model are used to better understand the operation of the system (whether that system is real or theoretical), as well as to conduct various "what-if"-type analyses. However, I recently worked on another model