In 2013, Rick Wicklin blogged about visualizing matrices as heat maps using SAS/IML. That post reminded me that we had done a similar thing for the coefficient matrices in our optimization problems. In particular, we have developed some SAS macros to visualize the input data sets for the OPTLP (linear optimization) and OPTMILP (mixed integer linear optimization) procedures. The results are stunning pictures, revealing a lot of inner structure.
Practical optimization problems almost always have a very marked structure. Understanding and exploiting this structure is often critical to being able to solve the problem. Visualization is a key step toward this.
A couple of years ago, my colleague Philipp Christophel wrote some macros to visualize SAS MPS data sets. We then ran these on several hundred data sets and generated two sets of output images: 1024x768 PNG for casual viewing, and full resolution SVG to be able to dig deeper. Some of these MPS data sets are huge (the largest one is about 35GB), so the image creation took some time. Additionally, the largest SVG image is more than 7GB: that is a true test for any SVG writer/viewer.
Here is a gallery of the nicest ones with some explanation of where they come from. Each row corresponds to a constraint and each column to a decision variable. All of our instances are sparse, where only a small fraction of the coefficients are nonzero. In the plots below only the nonzero coefficients are colored.
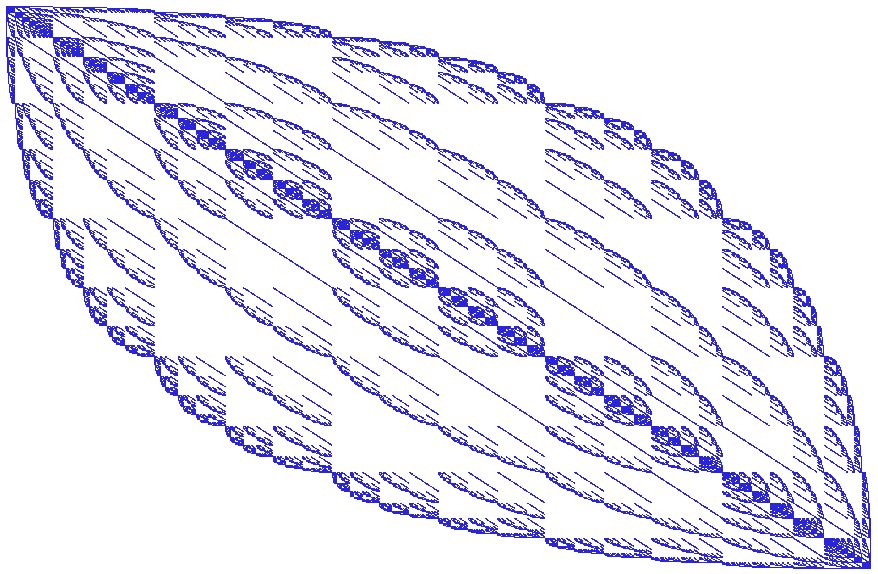
First a couple of instances where each nonzero coefficient is +1:
A set packing/covering instance coming from the Italian Railway company. From a distance it looks like a railway timetable. This is part of the MIPLIB2010 set.

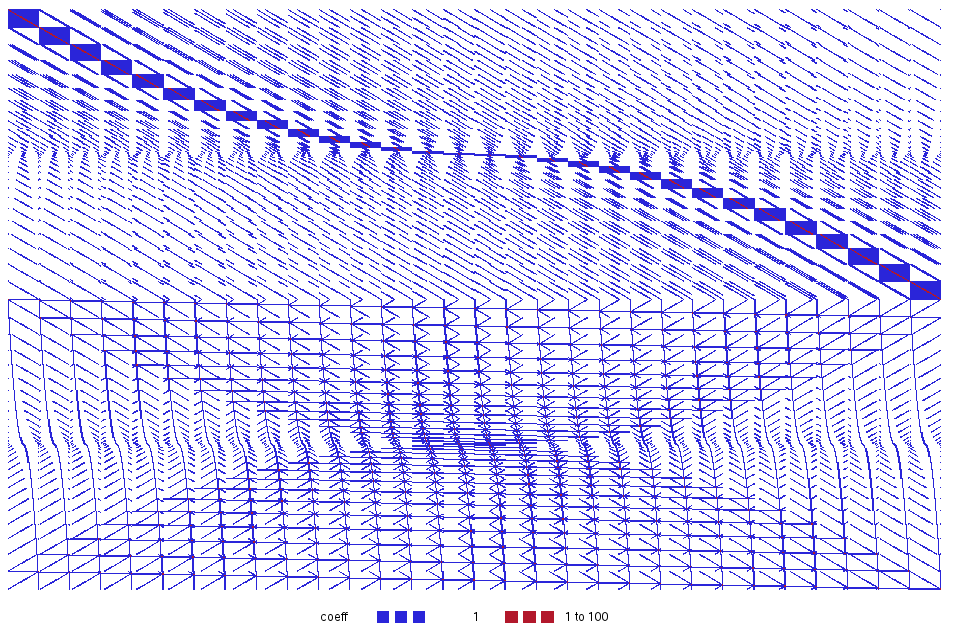
Next is a fully symmetric instance. All the variables are equivalent to each other. MILP solvers have to exploit this structure to be able to solve this instance in a reasonable time.
How to place a maximum number of queens on a 30x30 chessboard so that each queen attacks at most one other queen. Model from MIPLIB2010.
Next here are a couple of scheduling instances. First an ACC basketball scheduling instance, again from MIPLIB2010.
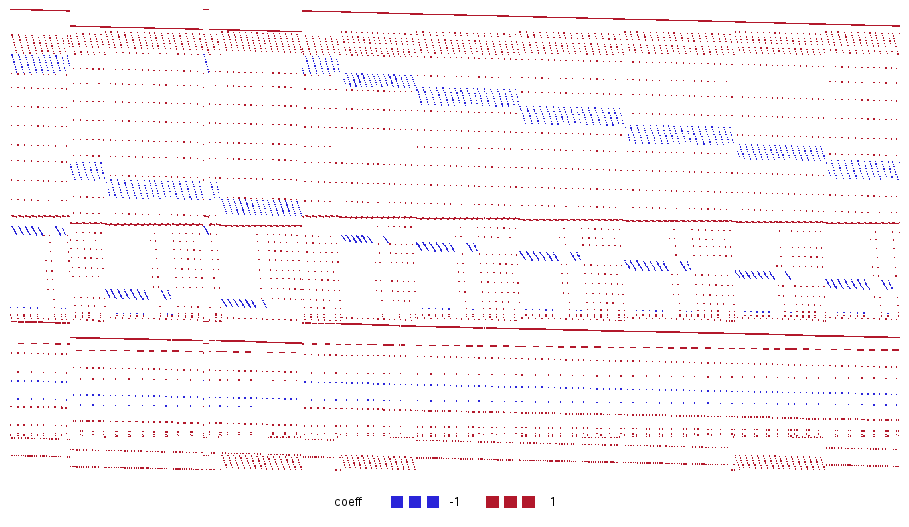
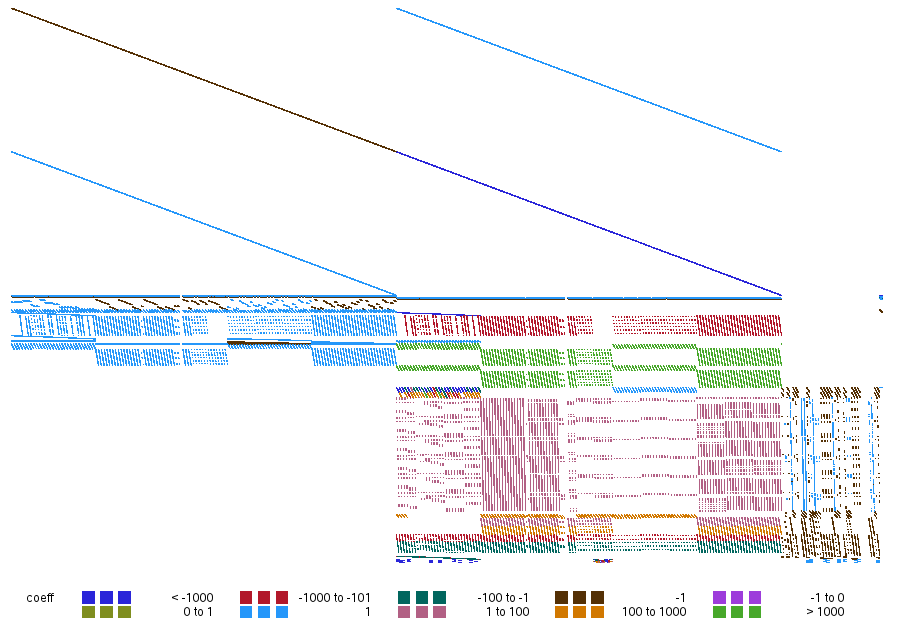
A workforce scheduling/assignment problem contributed by Gergely Bathó. You can see the nice block structure: that is a good candidate for decomposition: most constraints use only a few decision variables, and there are a few linking constraints (top and bottom) that impose some global restriction on the variables.
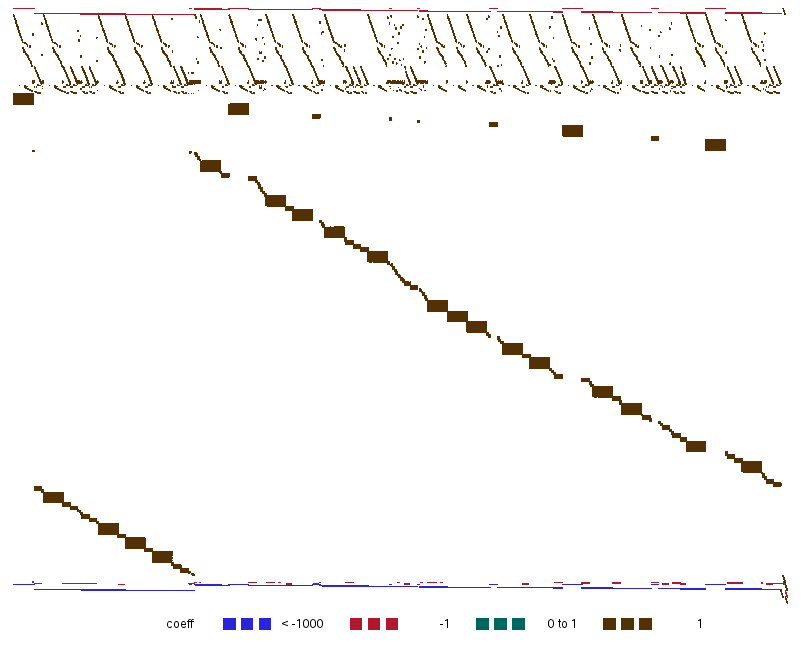
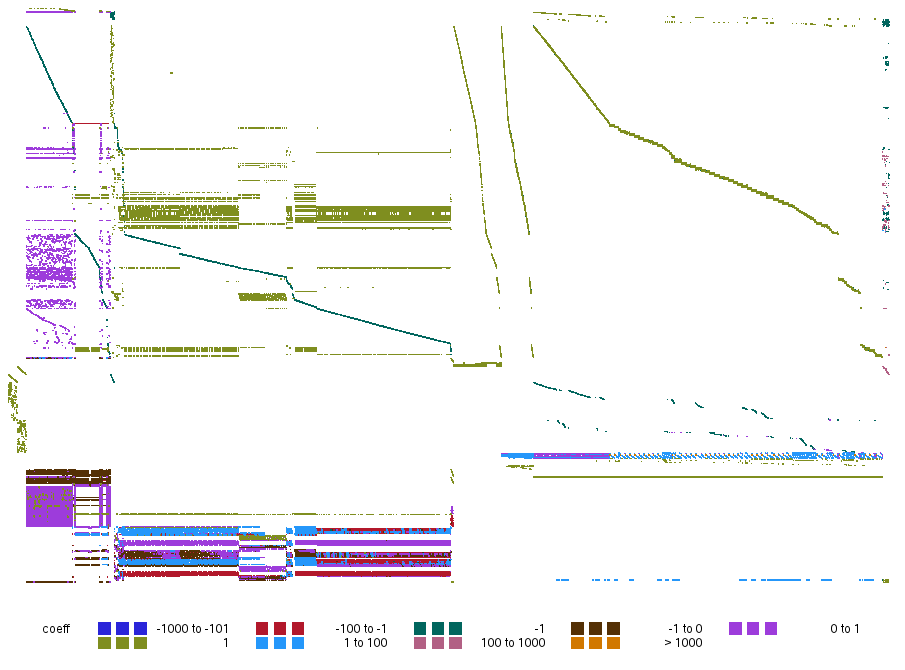
A fairly complicated model of scheduling ocean freight shipments. Again, you can clearly see the different kinds of variables and constraints and how the problem could be decomposed.
A production optimization model from a major oil company:
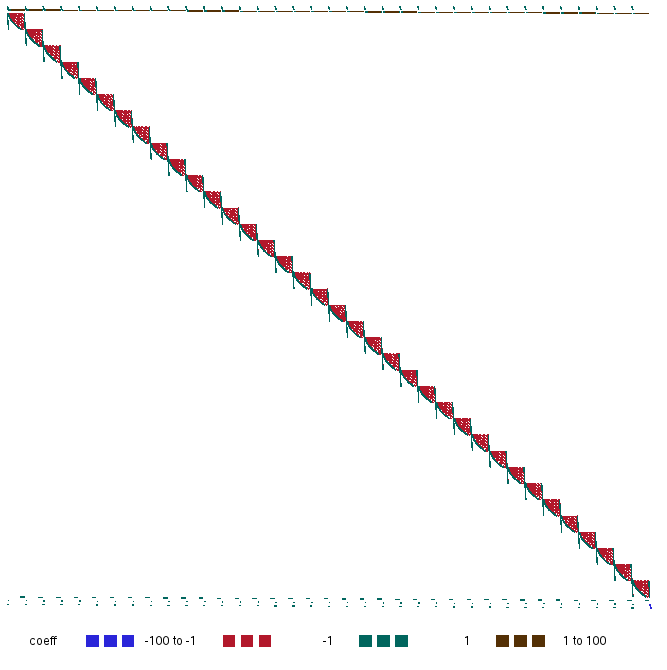
Finally, another instance with a very clearly decomposable structure, made up of a lot of tiny blocks.
Would you like to see any of these on your wall? Just leave a comment below and we can get you a high resolution image for printing. Also, feel free to share any tips you have on how we could make the plots nicer.

5 Comments
Wow! Phenomenally interesting visualization. You must've something really creative to order the rows & columns for the visual to work, random ordering of constraint rows and decision variable columns would probably not reveal the structure. Great work.
Thanks! Actually, rows and columns are in their original order. Similar variables and constraints tend to come in batches. You can see with some problems that reordering them would create an even nicer picture.
I did this for the NETLIB test set back in 1987 using a Mac. The full report can be found at http://web.stanford.edu/group/SOL/reports/SOL-87-11.pdf. The paper (without all of the picturees) was published in Computers & Operations Research.
Similar pictures showing the sparsity structure of the MIPlib instances can be found here: http://miplib.zib.de/miplib2010.php
We went beyond that and looked at the intersection graphs for instances of the MIPlib 2010. An example in a "nice" layout can be found here: http://www.yworks.com/assets/images/ygucd/mip.f3ae792c.png (http://www.yworks.com/actions/imageviewer.php?img=/assets/images/ygucd/mip.f3ae792c.png&album=ygucd&fs=1).