Nobel Prize winners and SAS causal econometrics software

In a Q&A with SAS' Udo Sglavo, Xilong Chen of SAS parses the work of 2021 Nobel Prize winners for Economics.
In a Q&A with SAS' Udo Sglavo, Xilong Chen of SAS parses the work of 2021 Nobel Prize winners for Economics.
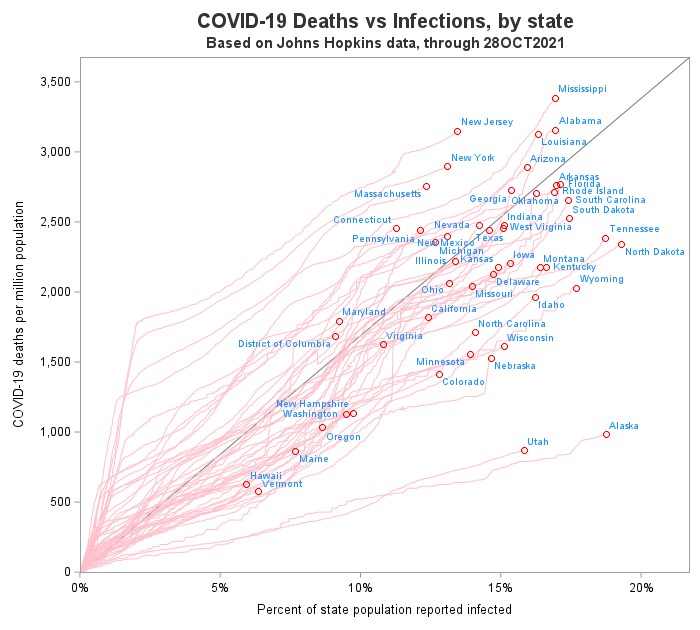
A scatter plot is my go-to graph! It's what I often start with to get a feel for the data ... and I often end up using just a scatter plot. But some scatter plots are better than others ... In this blog post, I create a scatter plot of

When SAS 9 programmers transition to SAS Viya, there are inevitably questions about how new concepts in Cloud Analytic Services (CAS) relate to similar concepts in SAS. This article discusses the question, "What is the difference between a libref and a caslib?" Both are used to access data, but they

